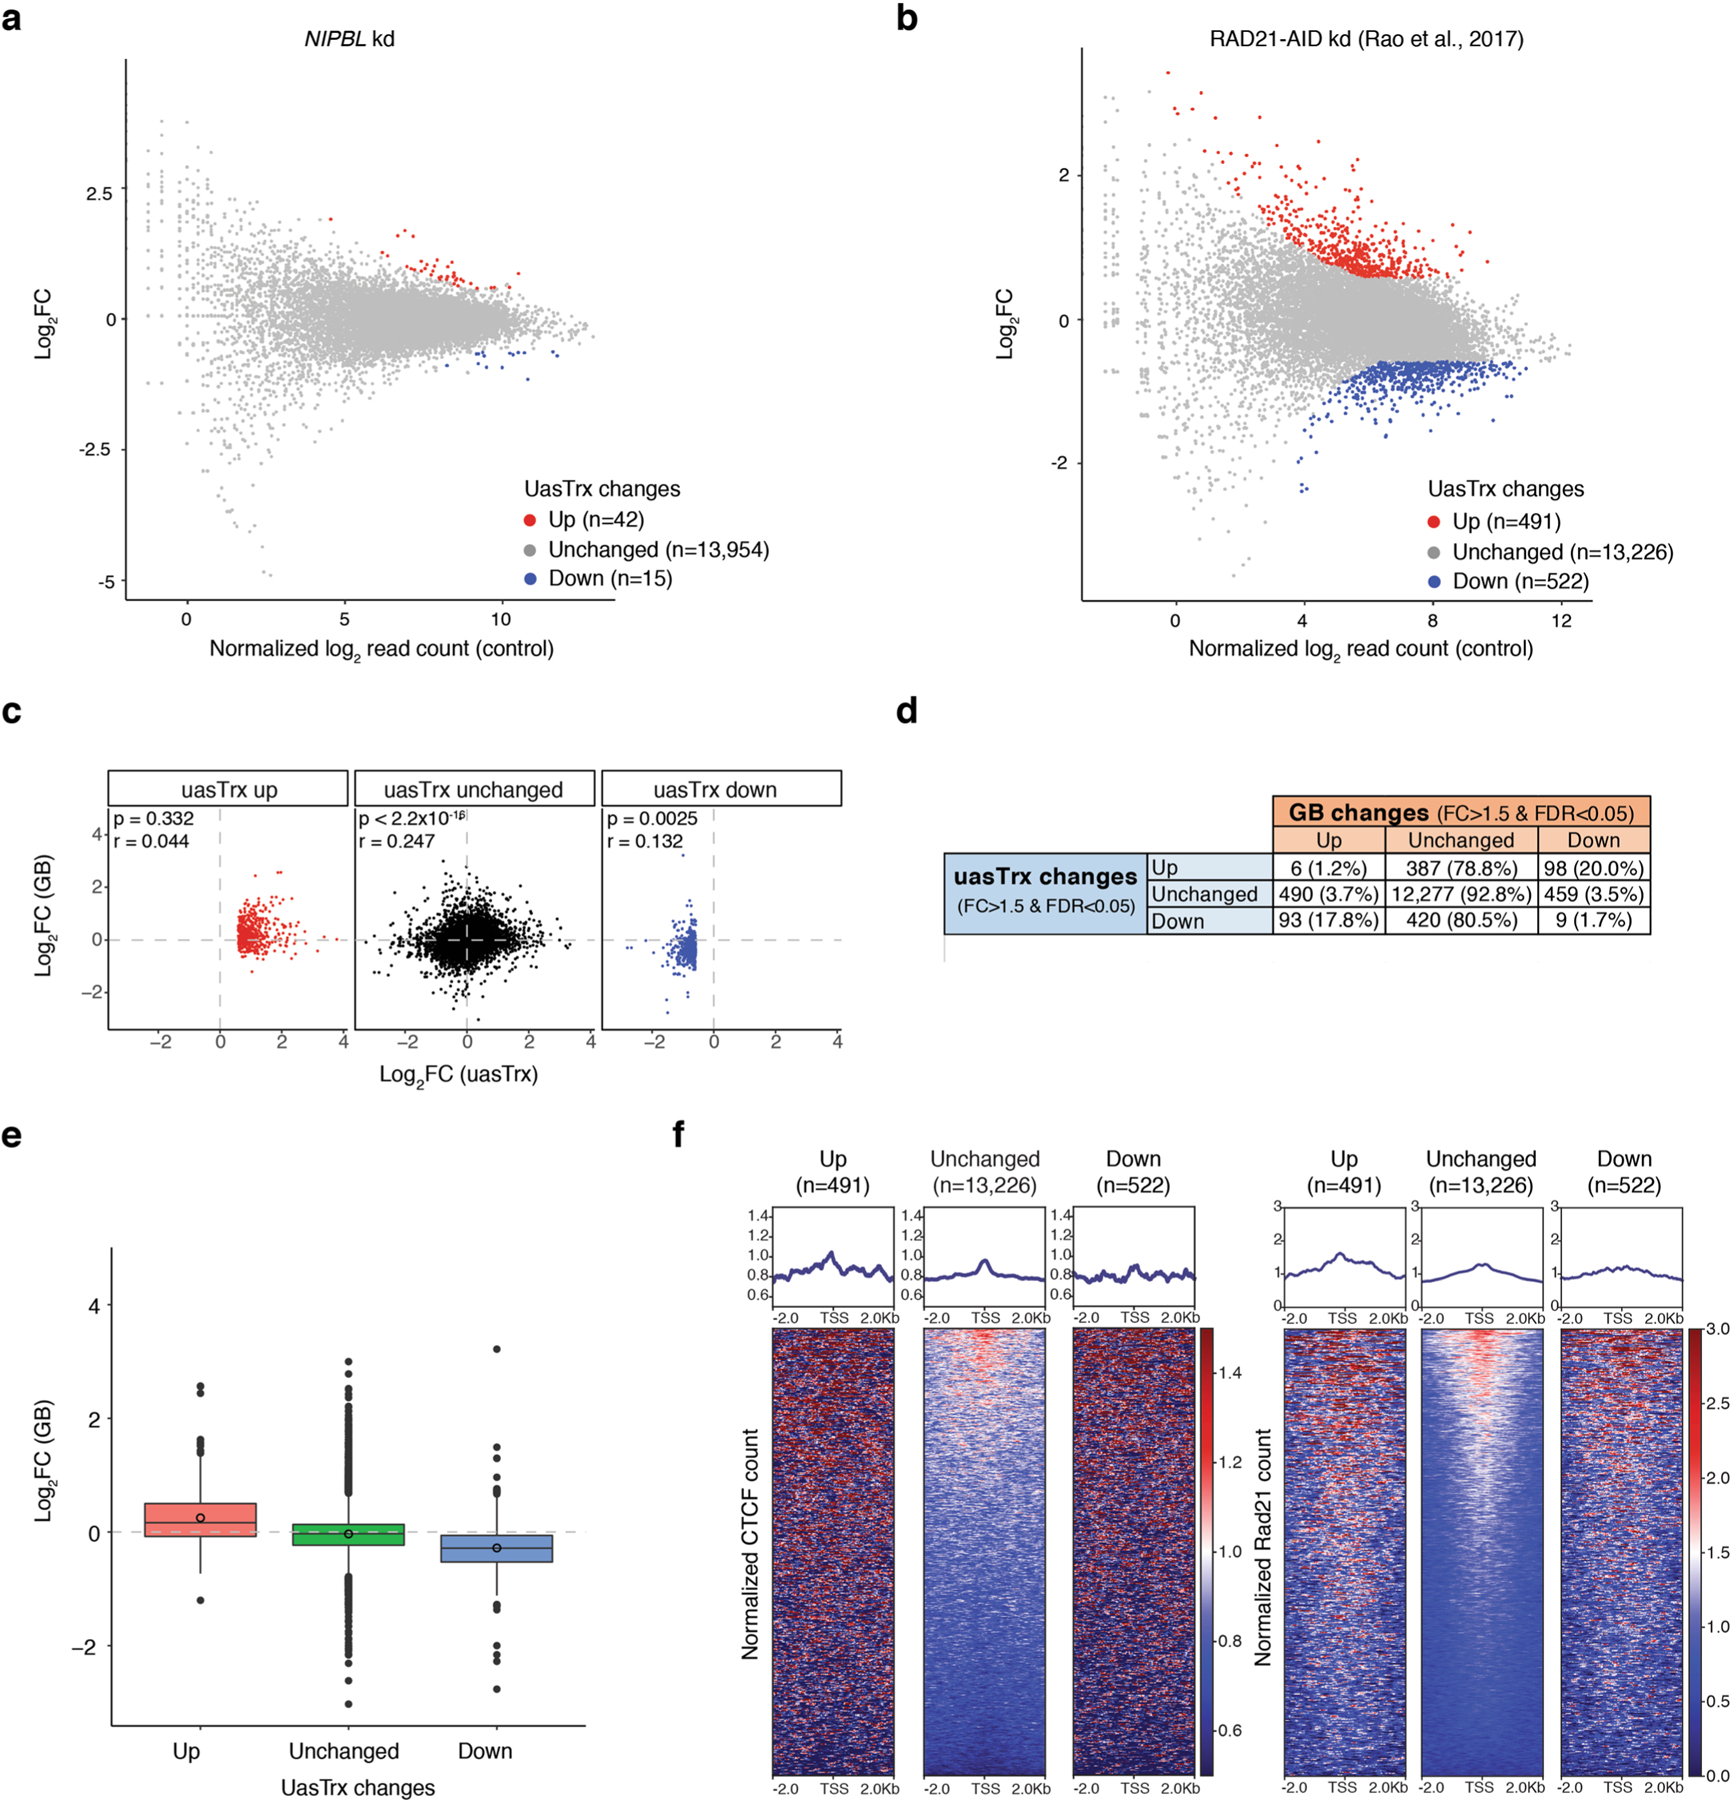
Extended Data Fig. 6 |. Removal of chromatin-bound cohesin does not recapitulate CTCF-induced uasTrx changes.

a, PRO-seq MA plot of control versus NIPBL-depleted HCT-116 cells on uasTrx expression (−1000 bp to +200 relative to annotated TSS). Differentially expressed transcripts highlighted in color. b, Same as (a) but of RAD21-depleted HCT-116 cells. c, Scatterplot comparing log-transformed 5’ PRO-seq fold changes in uasTrx and GB. P value was calculated by Spearman rank correlation test; r is the correlation coefficient. d, Table showing the number and percentage of uasTrx and GB changes after RAD21 depletion in HCT-116 cells. e, Box plot showing log-transformed PRO-seq fold changes in GBs after RAD21 depletion in HCT-116 cells. Lower and upper box ends represent the first and third quartiles with the median indicated as a horizontal line within the box. Mean is indicated by a circle within the box. Whiskers define the smallest and largest values within 1.5 times the interquartile range below the first or above the third quartile, respectively. Outliers are plotted as individual dots. f, Left, row-linked heatmap showing CTCF occupancy at active promoters, grouped by uasTrx changes after RAD21 depletion, sorted by occupancy levels, and shown with respect to sense orientation. Right, same as left, but plotting RAD21 occupancy. Note that neither CTCF nor RAD21 is enriched at genes with upregulated uasTrx.
