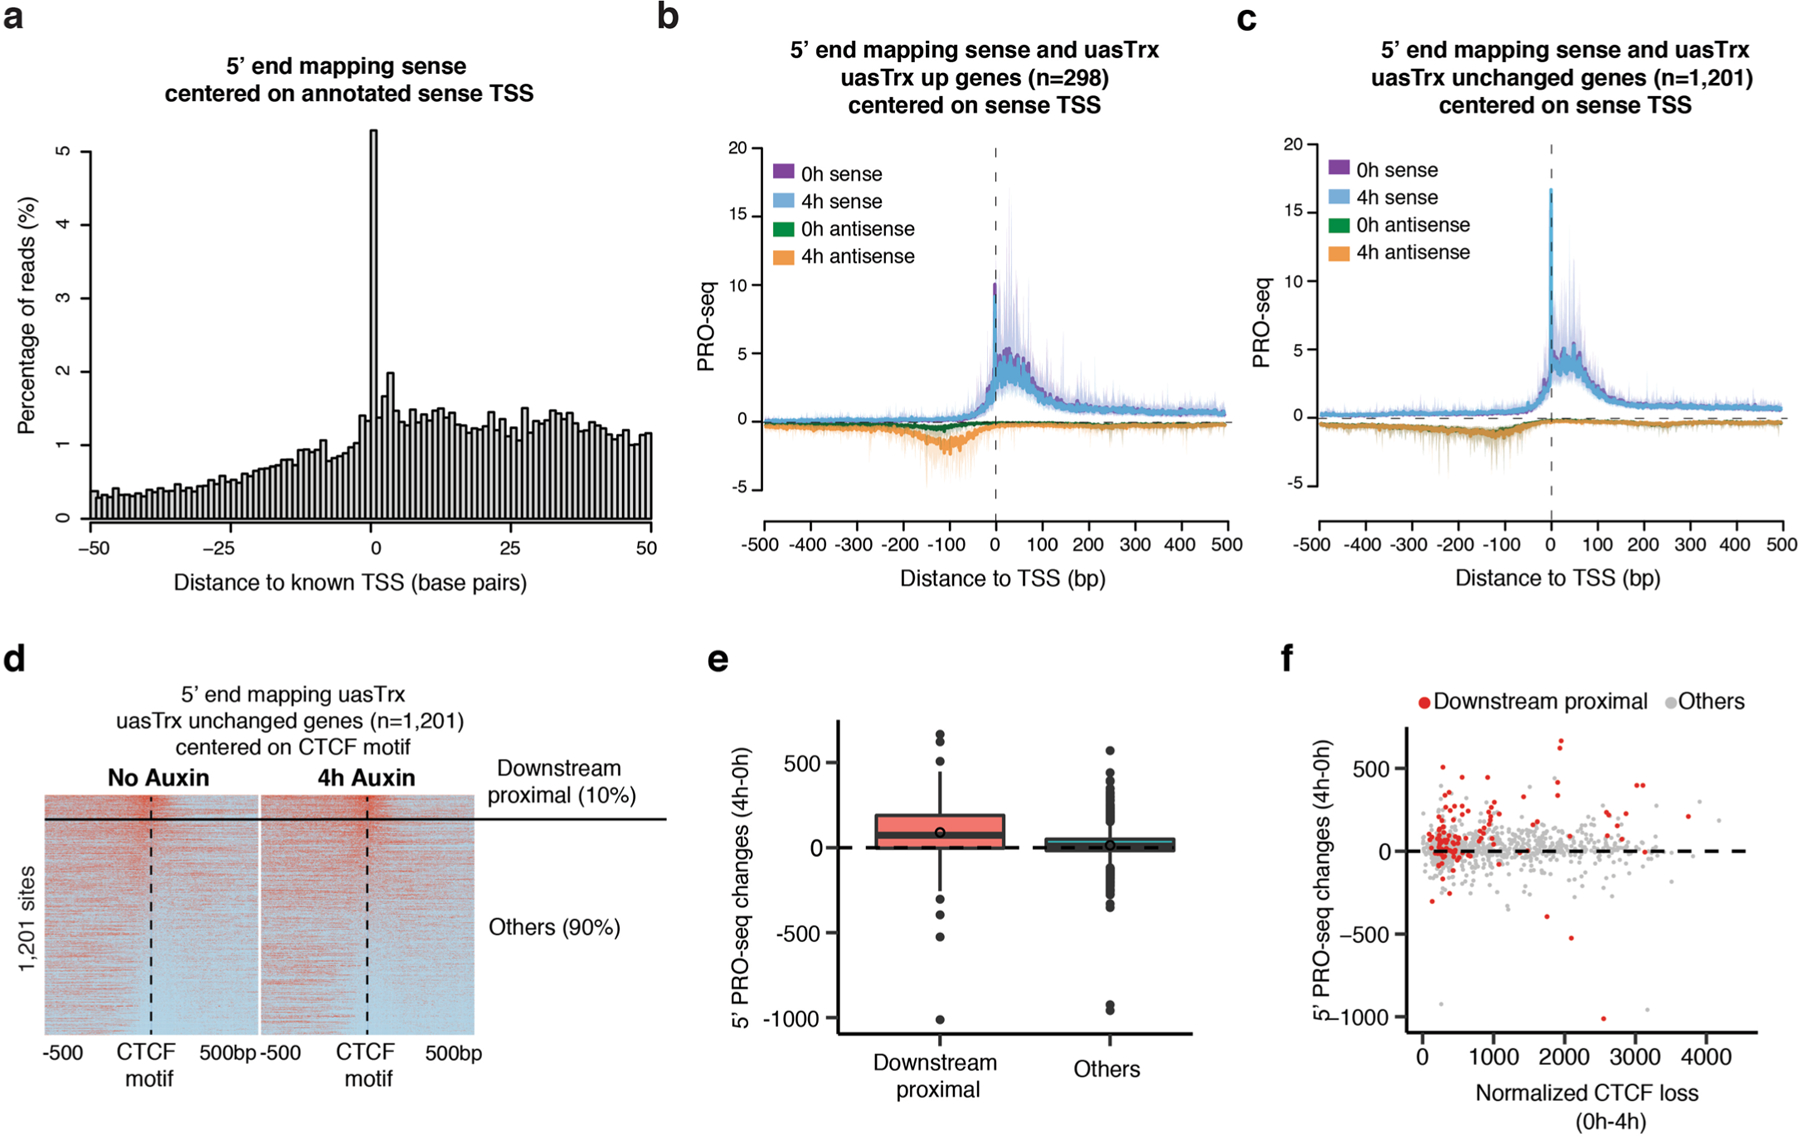
Extended Data Fig. 8 |. CTCF inhibits antisense transcription initiation through precise positioning.

a, 5’ end mapping in a 100 bp window of sense reads on a training set of 1,395 TSSs with the highest PRO-seq reads mapped to ±50 bp around the TSS and no other start sites within 1000 base pairs. b, Metaplot of sense and antisense 5’ end PRO-seq mapping, centered at annotated sense TSSs and plotted with respect to sense orientation for genes with upregulated uasTrx. Solid lines and shades show average signals and the 12.5/87.5 percentiles, respectively. c, Same as in (b) for unchanged uasTrx genes. d, heatmap of 5’ end mapping at unchanged promoters with a portion of sites (10%; ‘downstream proximal’) manually picked from the rest (‘others’), which demonstrates a CTCF distribution similar to that at uasTrx up genes. e, Related to (d), plotting PRO-seq changes in uasTrx at unaffected promoters, grouped based on CTCF positioning relative to 5’ PRO-seq signals. Lower and upper box ends represent the first and third quartiles with the median indicated as a horizontal line within the box. Whiskers define the smallest and largest values within 1.5 times the interquartile range below the first or above the third quartile, respectively. Outliers are plotted as individual dots. f, Related to (d), comparing uasTrx changes and CTCF binding loss at unaffected promoters, grouped based on CTCF positioning relative to 5’ PRO-seq signals.
