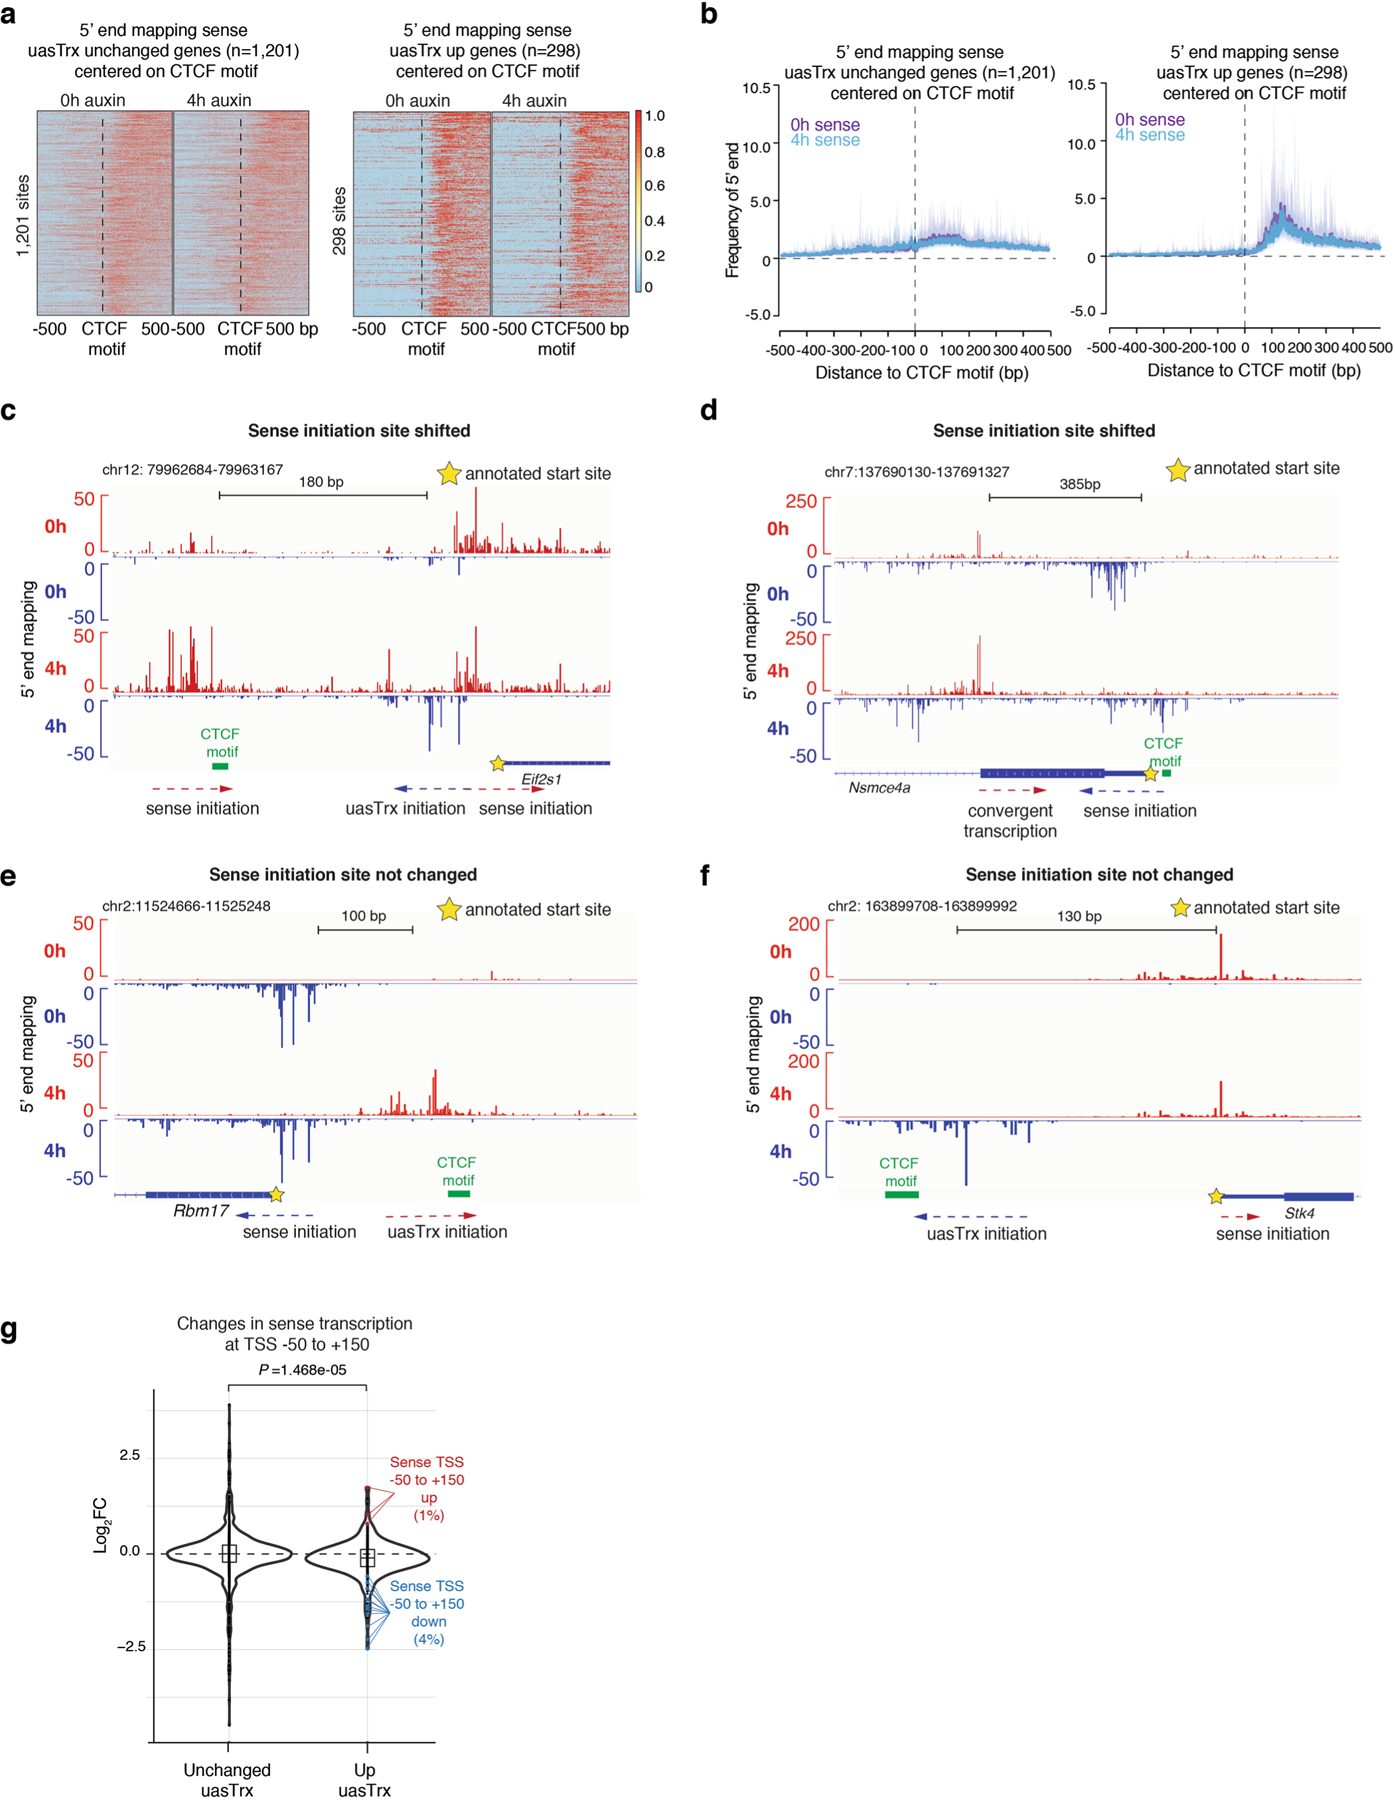
Extended Data Fig. 9 |. Sense transcription initiation mostly unaffected upon uasTrx increase.

a, Heatmap of 5’ end mapping at genes with unchanged uasTrx (n = 1,201) that exhibit proximal CTCF binding and high-confidence CTCF motif(s) (motif prediction score>75), centered on CTCF motifs, sorted by mean antisense signal densities over the center 200 bp and shown with respect to sense orientation. Black line highlights CTCF motif locations. b, Metaplot of data in (a). c, 5’ end mapping of sense and uasTrx transcription at the Eif2s1 gene. Yellow star indicates annotated sense TSS, CTCF motif indicated in green. d, Same as in (c) for Nsmce4a. e, Same as in (c) for Rbm17. f, Same as in (c) for Stk4. g, Violin plot showing sense changes at TSS −50 to +150 bp. P value comparing conditions was calculated using a Wilcoxon rank sum test. Significant differentially enriched TSSs are indicated in colors. Boxes within violins represent first and third quartiles with the median indicated as an horizontal line within the box. Whiskers define 1.5× the interquartile range. Outliers are plotted as individual dots.
