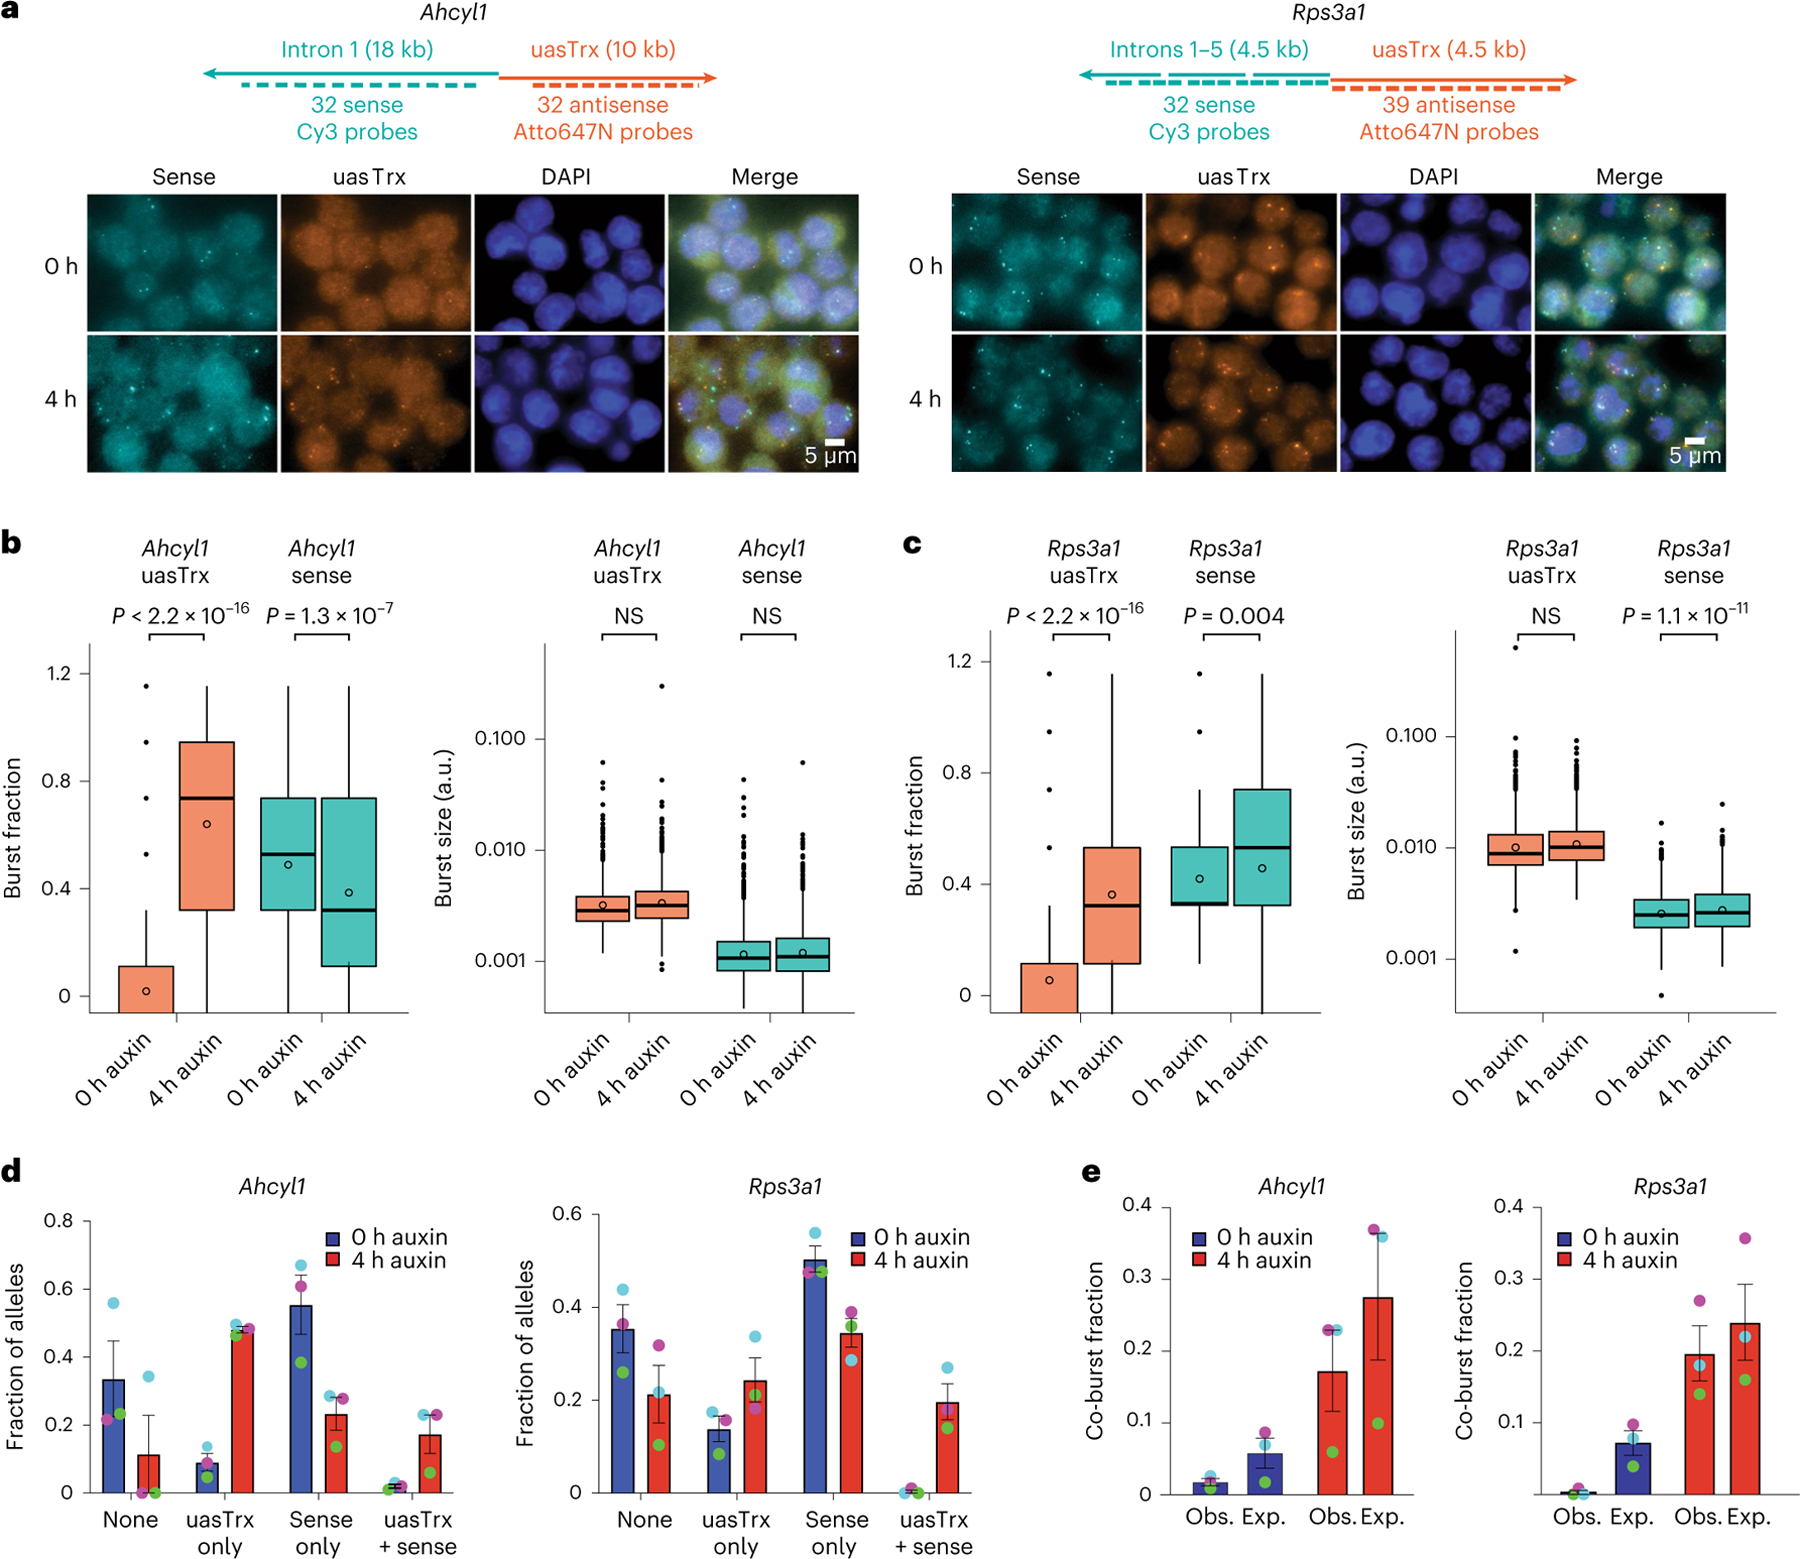
Fig. 3 |. CTCF mainly regulates antisense burst fraction, and sense and antisense co-bursting is disfavored at divergent promoters.

a, Top: maps of RNA-FISH probes targeting sense and antisense nascent transcripts at Ahcyl1 and Rps3a1 loci. Bottom: representative FISH images of three independent replicates before and after CTCF depletion. b, Left: box plot showing antisense and sense burst fractions before and after CTCF depletion at Ahcyl1. Right: box plot showing antisense and sense burst sizes before (0 h) and after (4 h) CTCF depletion. n = 3 biological replicates. P values were calculated by a two-sample t-test. Lower and upper box ends represent the first and third quartiles, with the median indicated as a horizontal line within the box. The mean is indicated by a circle within the box. Whiskers define the smallest and largest values within 1.5 times the interquartile range below the first or above the third quartile, respectively. Outliers are plotted as individual dots. c, As in b but for Rps3a1. d, Left: fraction of Ahcyl1 alleles with different sense/antisense burst status at 0 h and 4 h auxin (error bar, s.e.m.; n = 3). Right: same but for Rps3a1. Biological replicates are matched by dot color. e, Left: expected and observed co-burst fraction at Ahcyl1 at 0 h and 4 h auxin (error bar, s.e.m.; n = 3). Right: same but for Rps3a1. Biological replicates are matched by dot color.
