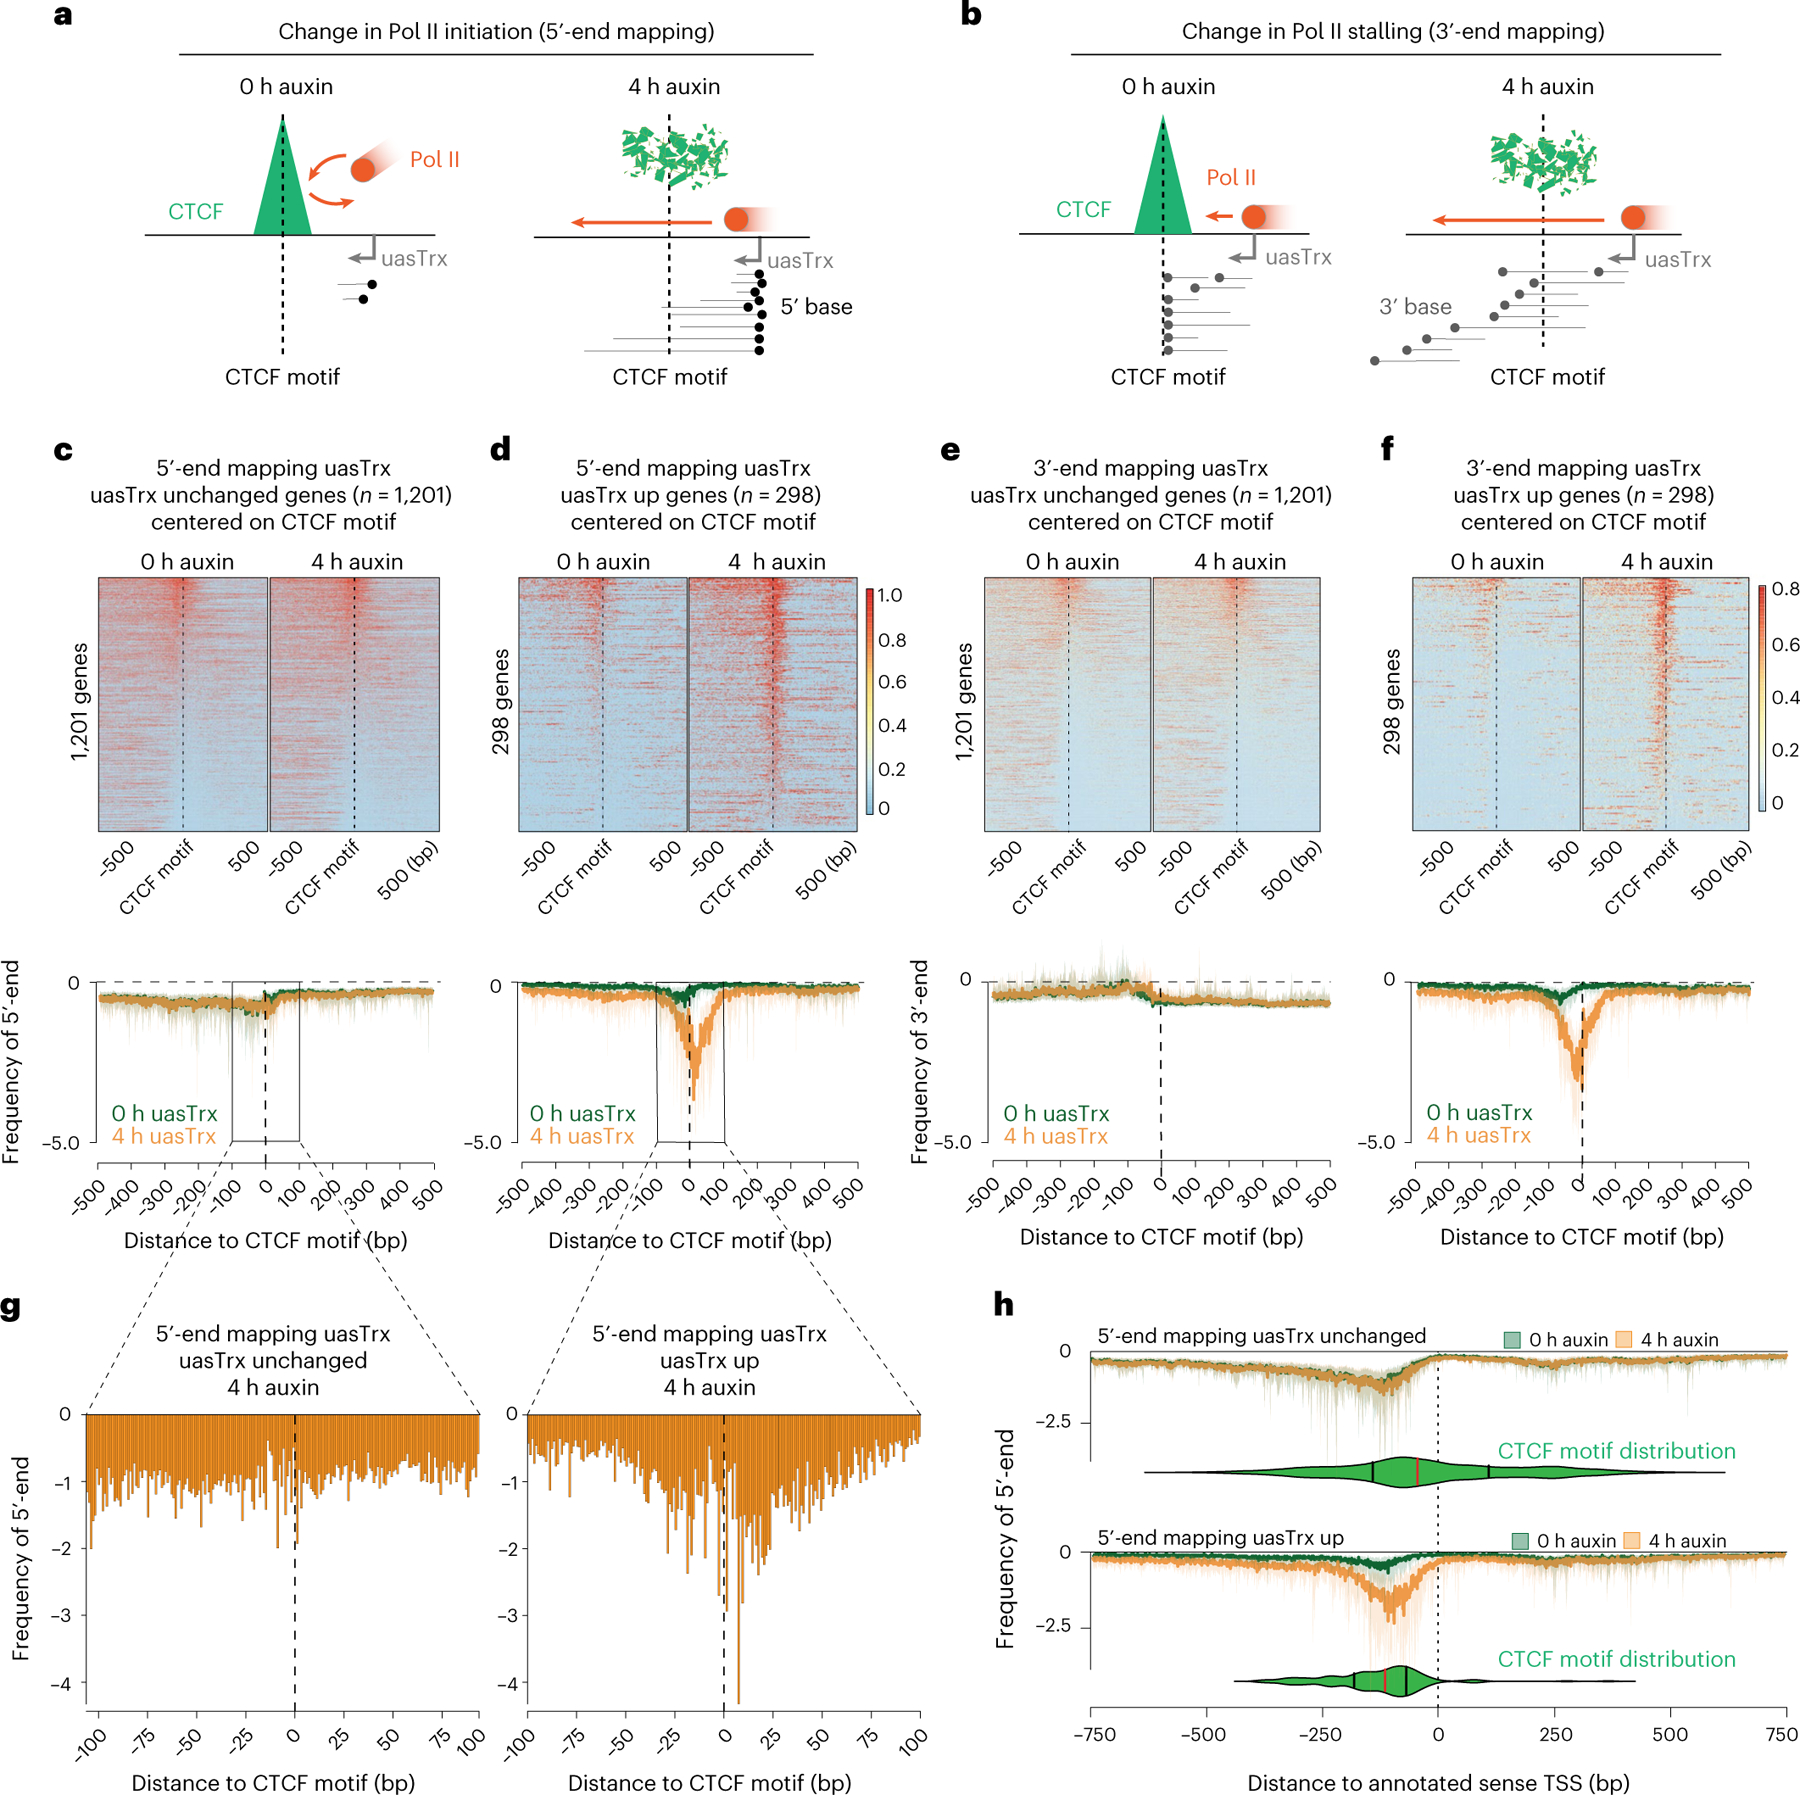
Fig. 4 |. CTCF inhibits antisense transcription initiation through TSS-proximal binding.

a, Model illustrating expected 5′-end mapping changes if CTCF blocks transcription initiation. b, Model illustrating expected 3′-end mapping changes if CTCF blocks Pol II stalling. c, Top: 5′-end mapping at genes with unchanged uasTrx (n = 1,201) that exhibit proximal CTCF binding and high-confidence CTCF motif(s) (motif prediction score > 75), centered on CTCF motifs, sorted by mean antisense signal densities over the center 200 bp and shown with respect to sense orientation. Black dashed lines highlight CTCF motif locations. Bottom: metaplot of data in the upper panel. d, As in c but for genes with upregulated uasTrx. e, Top: 3′-end mapping at genes with unchanged uasTrx (n = 1,201). Bottom: metaplot of data in the upper panel. f, As in e but for genes with upregulated uasTrx (n = 298). g, Zoom of 5′-end mapping of uasTrx, centered on the CTCF motif, after (4 h) CTCF depletion at genes with unchanged and upregulated uasTrx. h, 5′-end mapping before (0 h) and after (4 h) CTCF depletion centered on the annotated sense TSS. CTCF motif locations are indicated by the green violin plots (median in red, upper and lower quartiles in black) below PRO-seq tracks.
