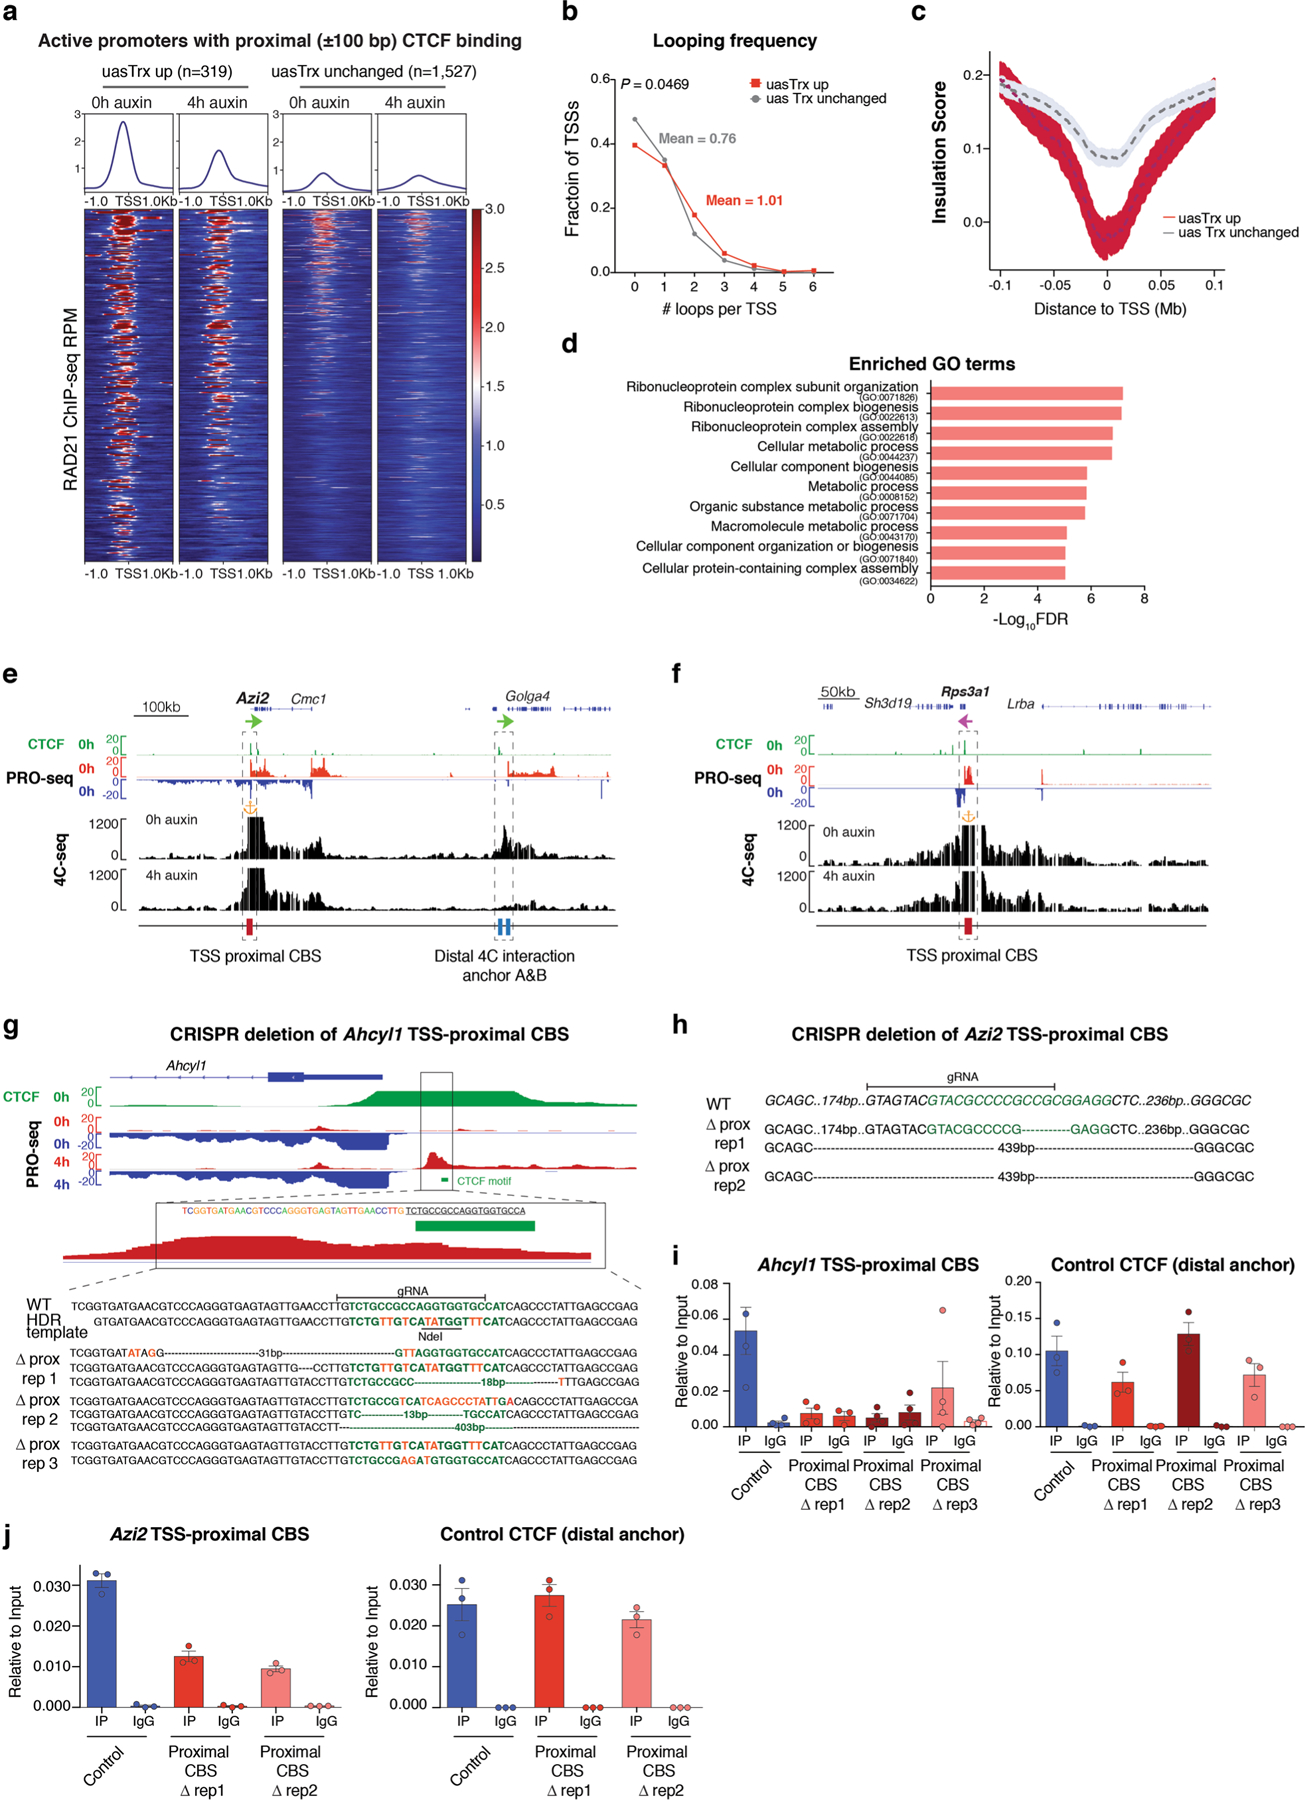
Extended Data Fig. 3 |. Affected promoters are associated with architectural features.

a, Row-linked heatmaps showing RAD21 occupancy at sites with proximal (±100 bp) CTCF binding (up, n = 319; unchanged, n = 1,527), grouped by CTCF depletion-elicited uasTrx changes, sorted in the same order as Fig. 1i, and shown with respect to sense orientation. b, Distribution of looping frequencies of upregulated versus unchanged uasTrx with proximal (±100 bp) CTCF binding. P value calculated by Wilcoxon signed-rank test. c, Averaged insulation score centered at annotated TSS with proximal CTCF binding (up n = 319, unchanged n = 1,527) over 0.2 Mb window, plotted with respect to sense orientation, and grouped by uasTrx changes. d, Gene ontology terms enriched at genes with activated uasTrx. e, Genome browser views of CTCF ChIP-seq, PRO-seq and 4C-seq signals at Azi2. 4C-seq anchored at Azi2 promoter with (4 h auxin) and without (0 h auxin) CTCF degradation. Orange anchor indicates 4C-seq viewpoint. Sites of interest are indicated below the track and highlighted by dashed boxes. f, Same as in (e) for the Rps3a1 locus. g, Genome browser views of bulk CTCF ChIP-seq and PRO-seq at the Ahcyl1 locus. Predicted CTCF motif is highlighted in green and genotype of edited Ahcyl1 clones shown in Fig. 2c is depicted. h, Genotype of Azi2 TSS-proximally edited clones. Predicted CTCF motif highlighted in green. i, Left, CTCF ChIP-qPCR showing abrogation of CTCF binding at Ahcyl1 TSS-proximal CBS in mutants shown in Fig. 2c. Right, Ahcyl1 distal CBS served as a control for ChIP efficiency (error bar: SEM; n = 3). j, Same as in (i) for Azi2 TSS-proximal CBS.
