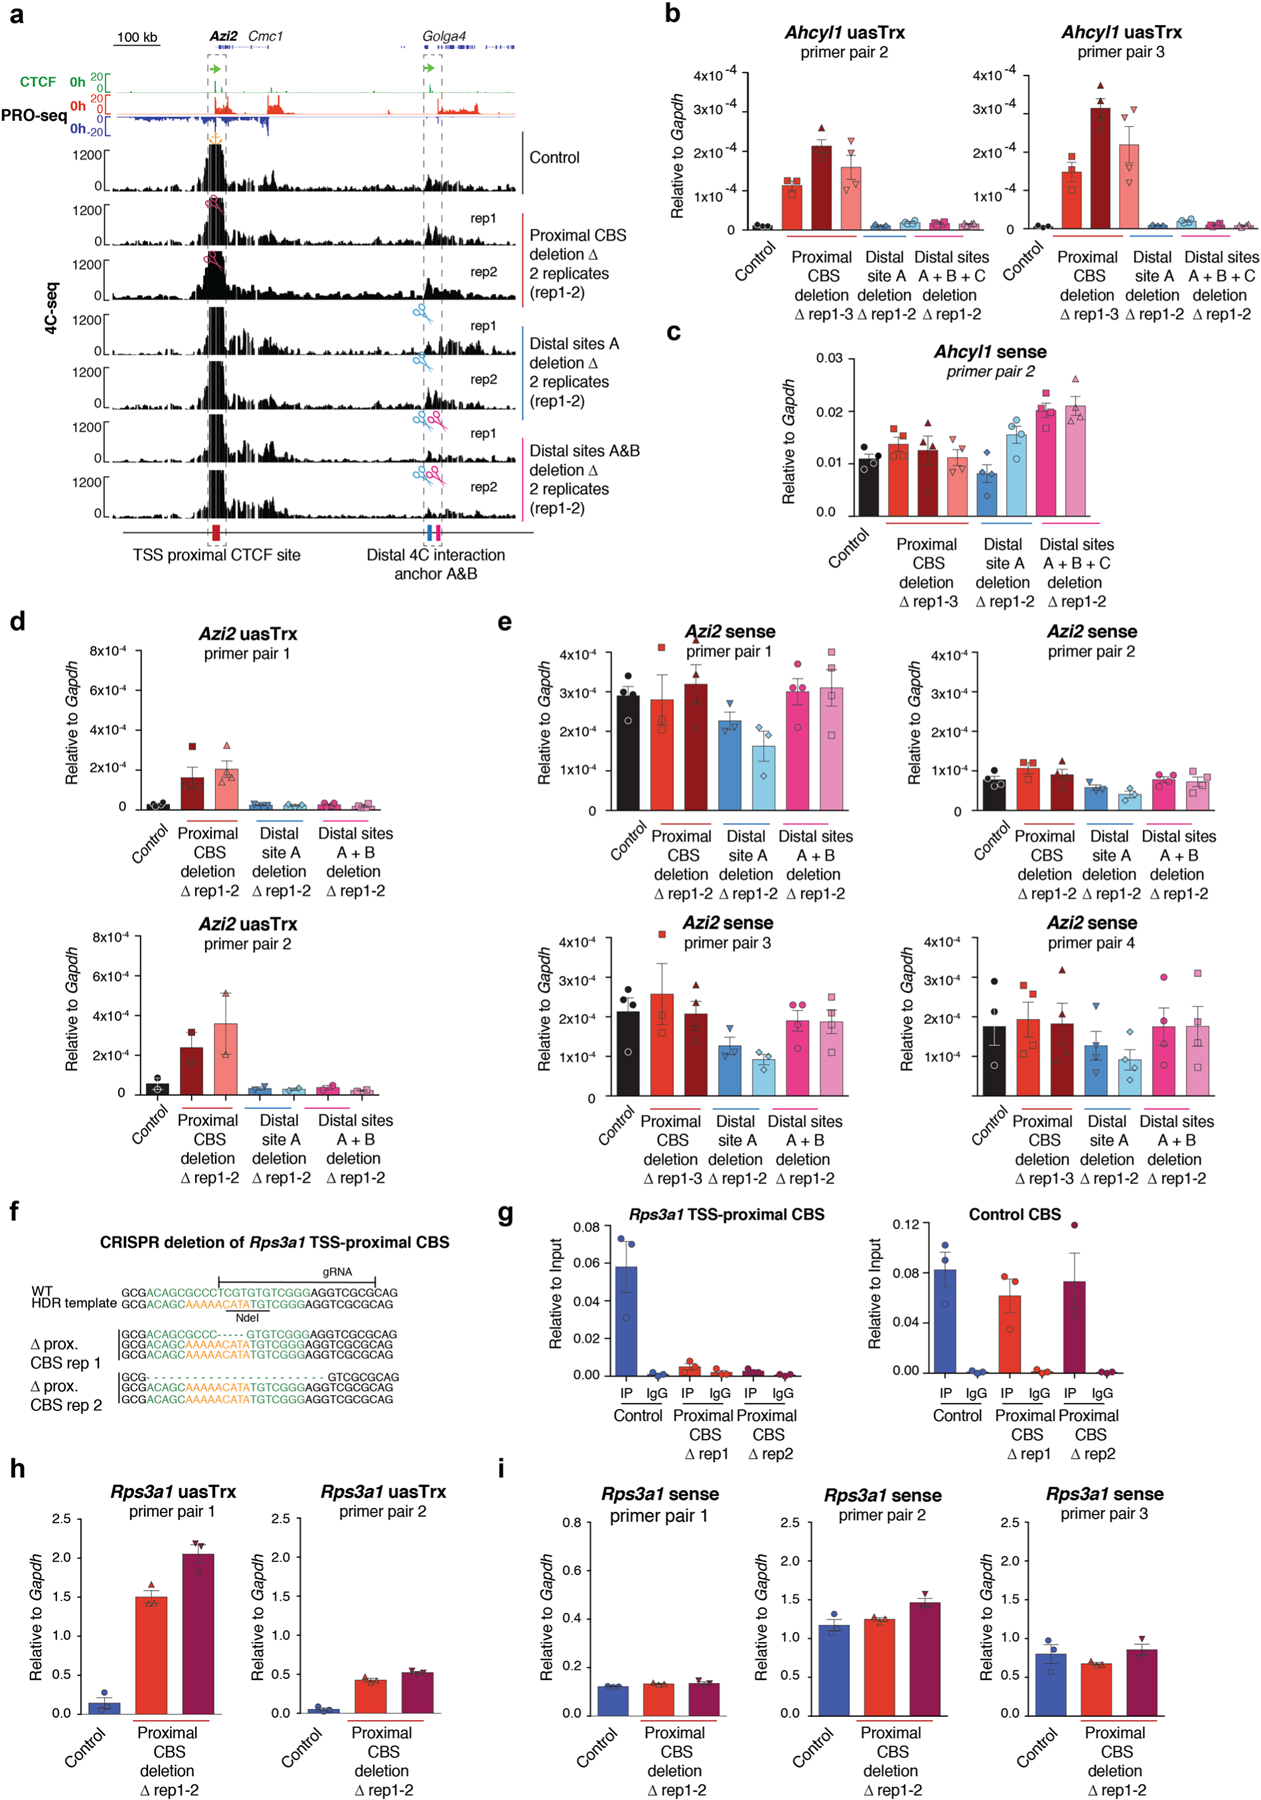
Extended Data Fig. 4 |. CRISPR/Cas9-mediated deletion of TSS-proximal CBS leads to uasTrx activation.

a, Genome browser tracks of CTCF ChIP-seq and PRO-seq shown at the Azi2 locus on top. Representative 4C-seq profiles of control/mutant Azi2 clones. Regions of interest are indicated below tracks and highlighted by dashed boxes. Similar observations were made in 2 independent 4C-seq experiments. Orange anchor indicates 4C-seq viewpoint. Scissors indicate CRISPR/Cas9-edited region. b, RT–qPCR of Ahcyl1 uasTrx in control and edited clones. Transcripts were normalized to Gapdh (error bar: SEM; n = 4, except for uasTrx control, proximal and distal CBS deletion rep1 for which n = 3). c, same as in (b) for sense Ahcyl1 transcripts. d, RT–qPCR of Azi2 uasTrx in control and edited clones. Transcripts were normalized to Gapdh (error bar: SEM; n = 4 for primer pair 1, n = 2 for primer pair 2). e, same as in (d) for sense Azi2 transcripts. f, Genotype of Rps3a1 TSS-proximal CBS edited clones. Predicted CTCF motif highlighted in green. g, Left, CTCF ChIP-qPCR showing abrogation of CTCF binding at Rps3a1 TSS-proximal CBS in mutants. Right, distal CBS served as a control for ChIP efficiency (error bar: SEM; n = 3). h, RT–qPCR of Rps3a1 uasTrx in control and edited clones. Transcripts were normalized to Gapdh (error bar: SEM; n = 3). i, same as in (h) for sense Rps3a1 transcripts.
