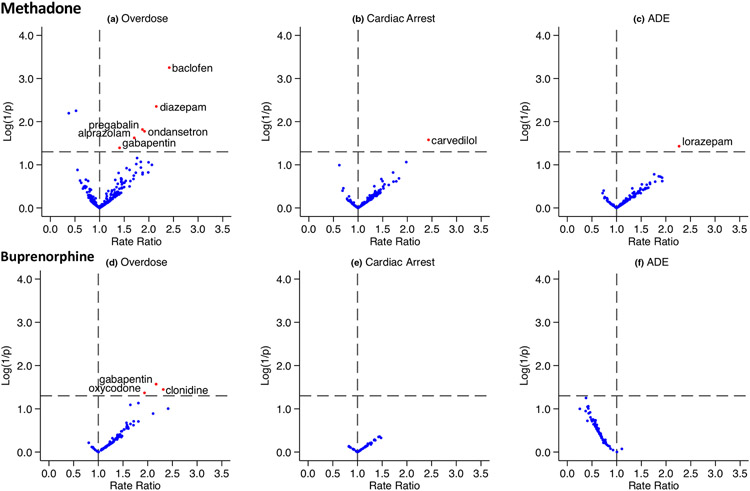
Figure 3.
Summary of pharmacoepidemiologic screening study results. Each panel depicts a volcano plot, with the x-axis representing the semi-Bayes shrunk adjusted rate ratio for target drug-precipitant pairs, and the y-axis representing the log (1/P value) for the semi-Bayes shrunk the adjusted rate ratio. Data points in the upper right quadrant represent statistically significant elevated rate ratios and are highlighted with red dots. (a) There were 258 candidate precipitants; (b) 147 candidate precipitants; (c) 142 candidate precipitants; (d) 104 candidate precipitants; (e) 54 candidate precipitants; and (f) 71 candidate precipitants. ADE, adverse drug events.

