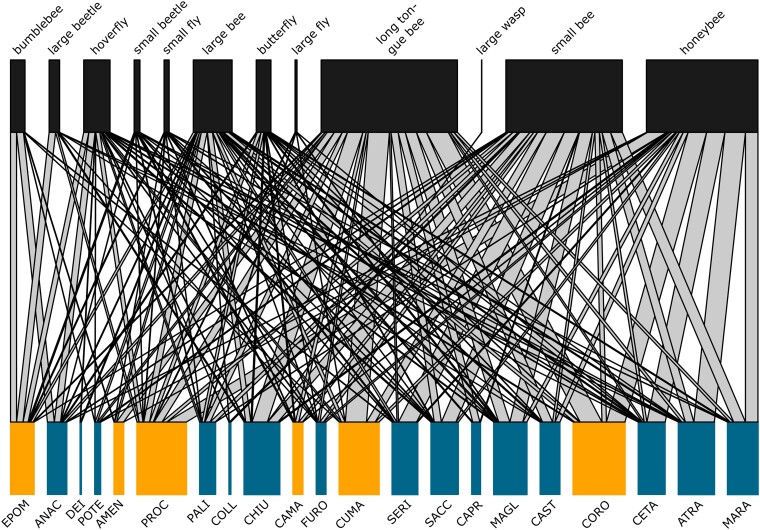
Fig. 2.
Brassica incana—pollinator interaction network for 21 natural populations. The upper part of the figure represents the 12 functional categories of pollinators. The size of boxes represents the total number of visits per functional category of pollinators observed in all 21 populations in springs of 2018 and 2019. The lower part of the figure represents the 21 natural populations of B. incana colored according to their soil type (tuff soil in orange, limestone soil in blue). The size of the boxes represents the total number of visits of all categories of pollinators combined per population. The width of the lines connecting functional categories of pollinators to populations indicates the proportion of visits observed per pollinator category within each population. Pollinator functional groups and plant population are ordered as such leading to as few crossings of interactions as possible.

