Figure 1.

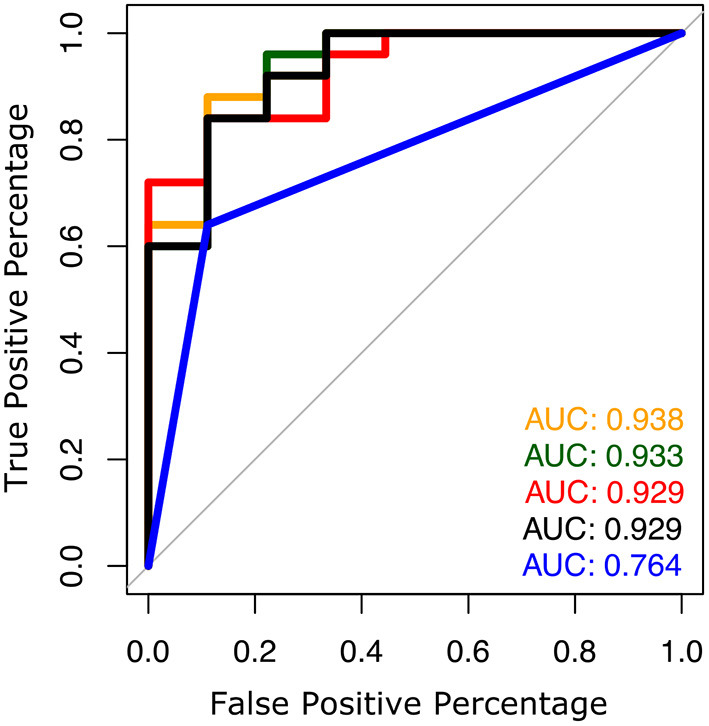
ROC plots to predict future falls based on falls history alone (blue line) and various combinations of gait measures (top 4 from Table 2).

ROC plots to predict future falls based on falls history alone (blue line) and various combinations of gait measures (top 4 from Table 2).