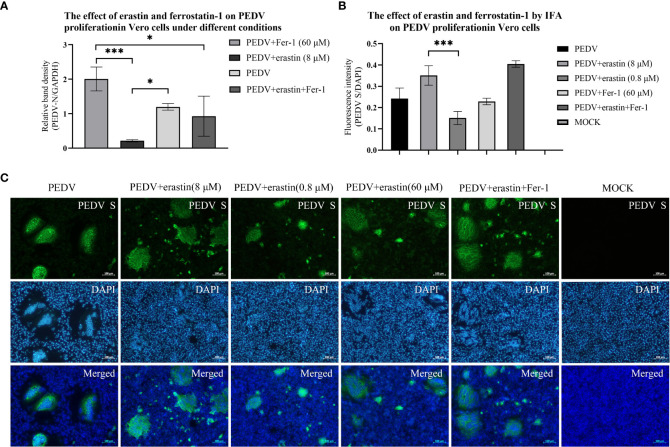
Figure 2.
Effects of erastin and Fer-1 on Vero cells infected by PEDV. (A) Relative quantification of PEDV for verification by RT-qPCR. The relative quantification of PEDV in Vero cells with different treatments by RT-qPCR was calculated by 2-ΔΔCt method. (B) The Analyze the fluorescence intensity of virus-infected cells in each of experiments by using the ImageJ software. Error bars represent standard deviations of technical triplicates. *P<0.05, ***P < 0.001, n = 3 per group. (C) Vero cell with different treatments were collected at 10 hours, fixed, permeabilized, and stained with PEDV S protein (rabbit), then rabbit protein antibody (goat). DAPI was used for nuclear staining. Images were taken using a microscope. Scale bar = 100 μm.

