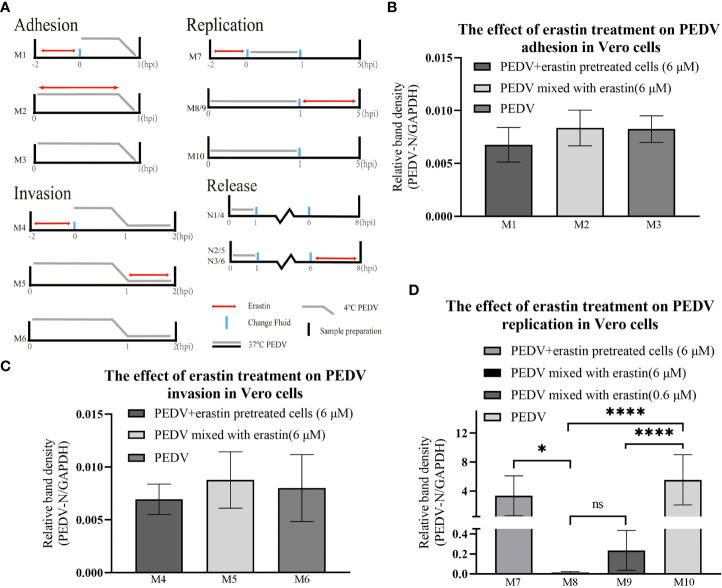
Figure 3.
Erastin affects the different stages of PEDV infection with Vero cell. (A) Vero cells or PEDV were treated with erastin in different ways before and after infection. Double-headed red arrows indicate the presence of erastin. The gray line indicates the PEDV infection. The experiments are identified in the text by the numbers on the left (M1-M10) and (N1-N6). Cell treatment time is calculated as hour post infection below. The relative quantity of RT-qPCR of PEDV in Vero cells treated with erastin was calculated by 2-ΔΔCt method. (B–D) The relative quantity of PEDV in Vero cells at the stages of adhesion, invasion and replication was verified by RT-qPCR. The error bar represents the standard deviation * P<0.05, **** P<0.001, 3 cases in each group. ns, not significant.

