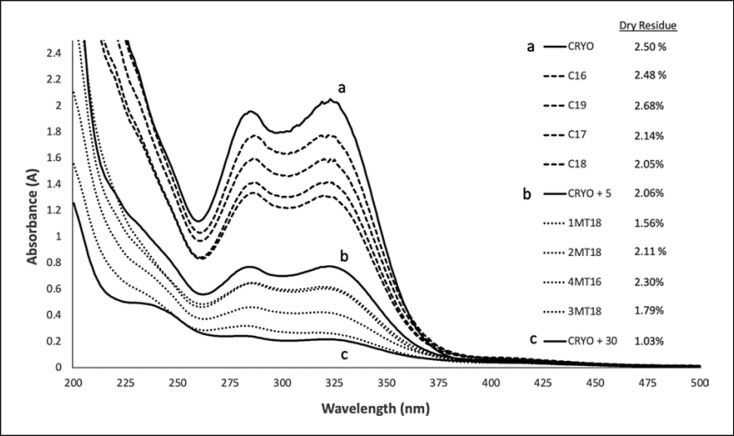
Fig. 3.
Spectrophotometric UV-visible analysis of commercial Melissa mother tinctures compared with the extracts prepared in the air exposure test. The letter a, b, and c correspond to the sample CRYO, CRYO_5, and CRYO_30, respectively. Name of extracts in the legends are ordered in descendent intensity of maximum absorption (between 318 and 323 nm).

