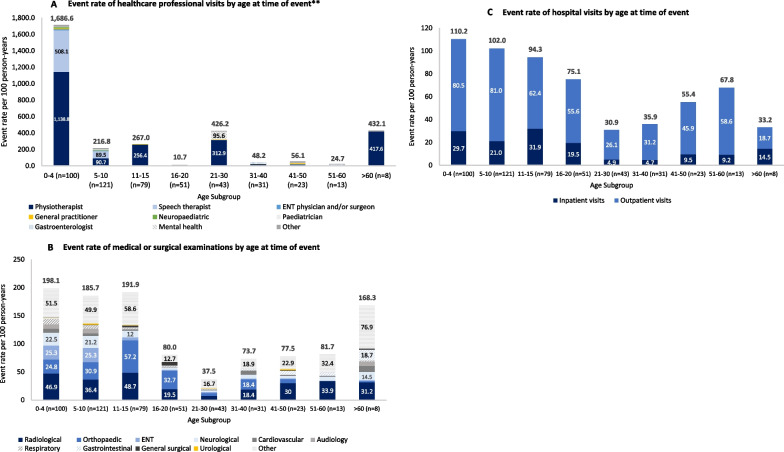
Fig. 3.
Healthcare resource use by age subgroup. Event rates per 100 person-years were calculated as the number of events divided by the total number of patient historical years multiplied by 100. **Results are displayed for healthcare professional types with an event rate of > 10 per 100 person-years in at least one age category. ‘Other’ healthcare professional visits include those to cardiologists, dentists, dermatologists, dieticians, emergency doctors, endocrinologists, geneticists, gynaecologists, neurologists, neurosurgeons, occupational therapists, ophthalmologists, orthopaedic physicians or respiratory physicians. ENT Ear, nose and throat

