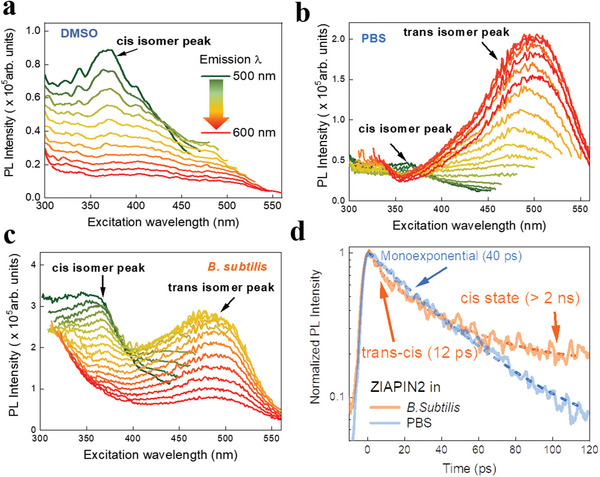
Figure 3.

Ziapin2 can undergo isomerization while in bacterial membrane. Excitation–emission profiles of Ziapin2 (10 µg mL−1) in a) DMSO, b) PBS, and c) B. subtilis cells. For each curve in plots (a–c) the emission wavelength is fixed at a value between 500 and 600 nm, with 10 nm steps (color lines go from green to red passing from 500 to 600 nm). d) Time‐resolved PL decay curves of Ziapin2 in PBS (orange line) and B. subtilis cells (blue line). The dashed lines represent the exponential best‐fit for the two curves.
