
Figure 3.
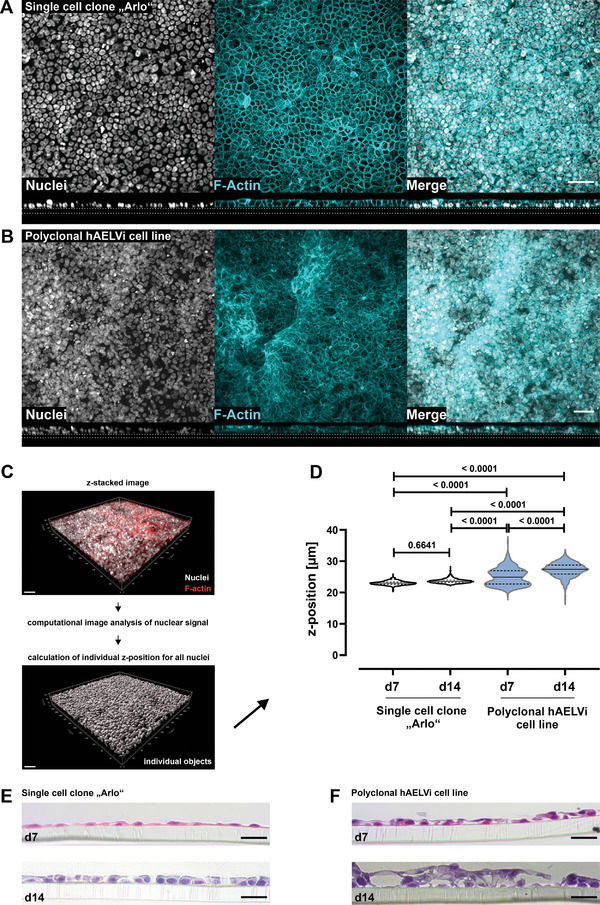
Different tissue morphology between the polyclonal hAELVi cell line and the single cell clone “Arlo.” A,B) Maximum projections from immunofluorescence staining showing cellular distribution as top view (upper panel) and the tissue morphology as orthogonal projections from z‐stacked images (lower panel) for A) the single cell clone “Arlo” as well as B) the polyclonal hAELVi cell line. Nuclei stained with DAPI (gray) as well as F‐Actin stained with phalloidin (cyan). Images are representative for 3 independent biological replicates. Scale bar: 50 µm. C) Schematic depicting the generation of individual digital objects for each cell, based on its nuclear signal by computational image analysis, computed from the information contained in z‐stacked confocal images. D) Computational image analysis of cellular z‐position computed from nuclear signal within different z‐stacks as a quantitative measure of the vertical cellular distribution within each in vitro tissue. 2‐way ANOVA was performed with a Tukey's multiple comparisons test. E,F) Histological tissue sections from the single cell clone “Arlo” as well as from the polyclonal hAELVi cell line stained with hematoxylin and eosin. Cells were grown under ALI conditions for 7 or 14 d. Representative for at least 2 biological replicates. Scale bar: 20 µm. A,B) For details concerning the deviating apparent scale bar please refer to the Experimental section.