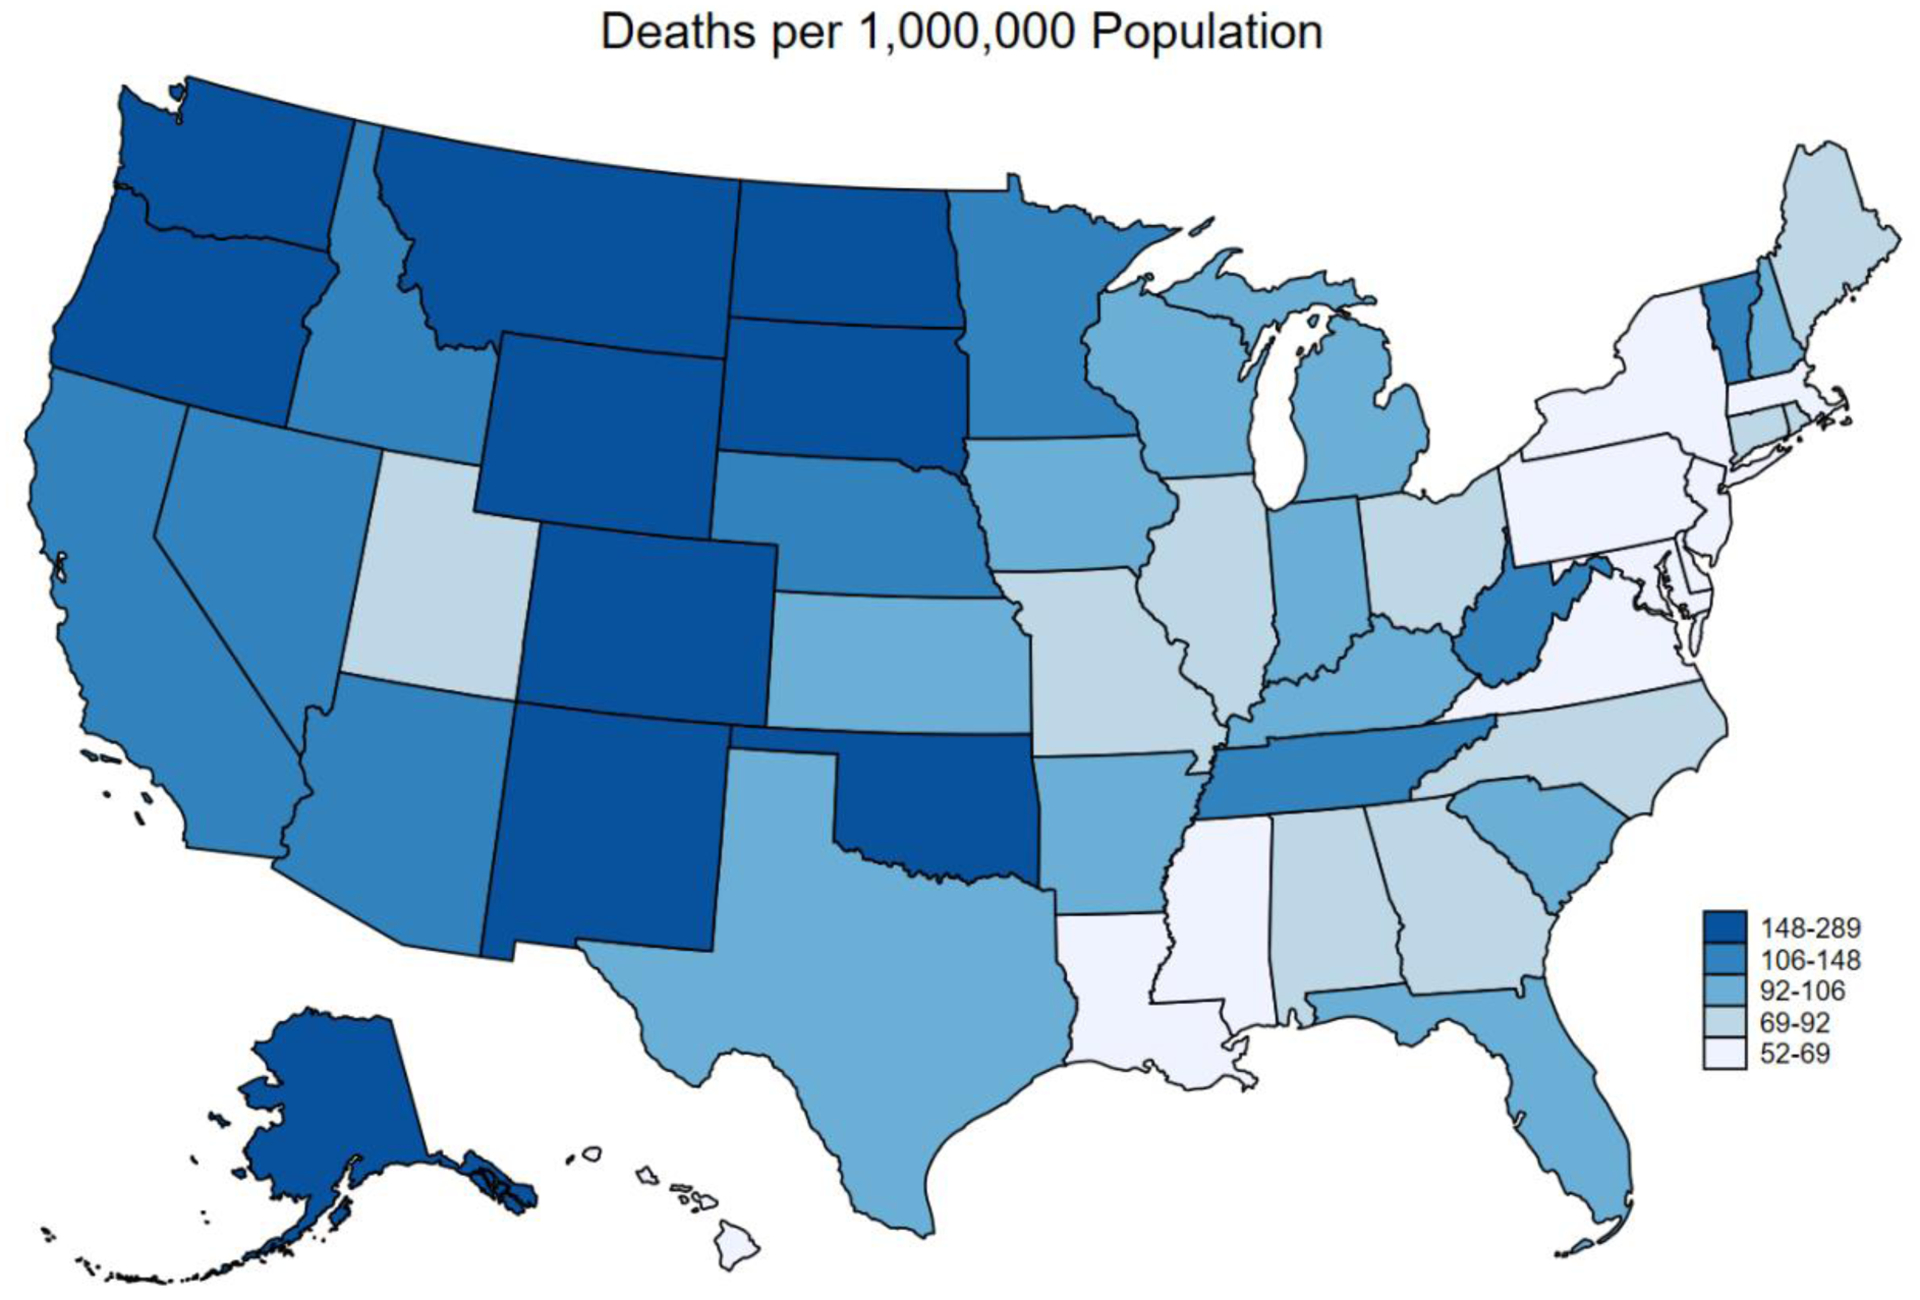
Figure 2B. State-Level Age-Adjusted Alcohol-Associated Liver Disease Mortality in 2019.

This map represents the age-adjusted alcohol-associated liver disease mortality by state in 2019, with darker shades representing higher mortality. There was variability in the state-level age-adjusted alcohol-associated liver disease mortality (lowest: New Jersey, Maryland, Hawaii [52 per 1,000,000 population]; highest: Wyoming [289 per 1,000,000 population]).
