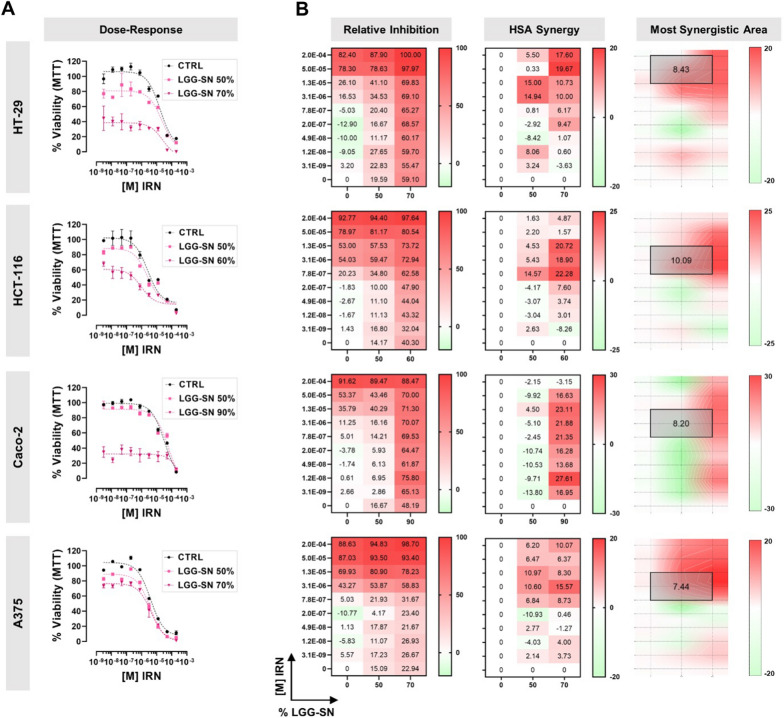
Fig. 5.
LGG-SN in combination with Irinotecan (IRN) shows a synergistic effect in cancer cells. A. HT-29, HCT-116, Caco-2, A375 concentration response plots. Cells treated with IRN (from 3.1 × 10⁻⁹ M to 2.0 × 10⁻⁴ M) in combination with different LGG-SN concentrations (50% and 70% v/v). B. HT-29, HCT-116, Caco-2, A375 relative inhibition matrices (left), Highest Single Agent (HSA) synergy matrices (middle), synergy surface with most synergistic area (black square, with corresponding HSA synergy score). N = 3. Values are presented as Mean ± SD

