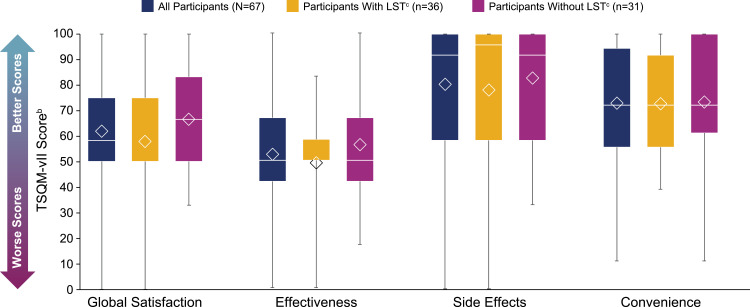
Figure 6.
TSQM-vII scoresa. The bottom and top edges of the box indicate Q1 and Q3, the line inside the box is the median, and the marker inside the box is the mean. The whiskers extending from the box indicate the minimum and maximum values.
Notes: aThe 8 participants in the full study population who reported no medication use are not included in this analysis. bScale of 0–100, with greater numbers indicating higher satisfaction; a poor appraisal of health was previously found to correspond to mean scores of 64.8 (global satisfaction), 63.3 (effectiveness), 75.8 (side effects), and 83.3 (convenience).26 cLong sleep was defined as ≥11 hours of sleep in a 24-hour period (self-reported).
Abbreviations: LST, long sleep time; Max, maximum; Min, minimum; Q1, first quartile; Q3, third quartile; SD, standard deviation; TSQM-vII, Treatment Satisfaction Questionnaire for Medication, version II.

