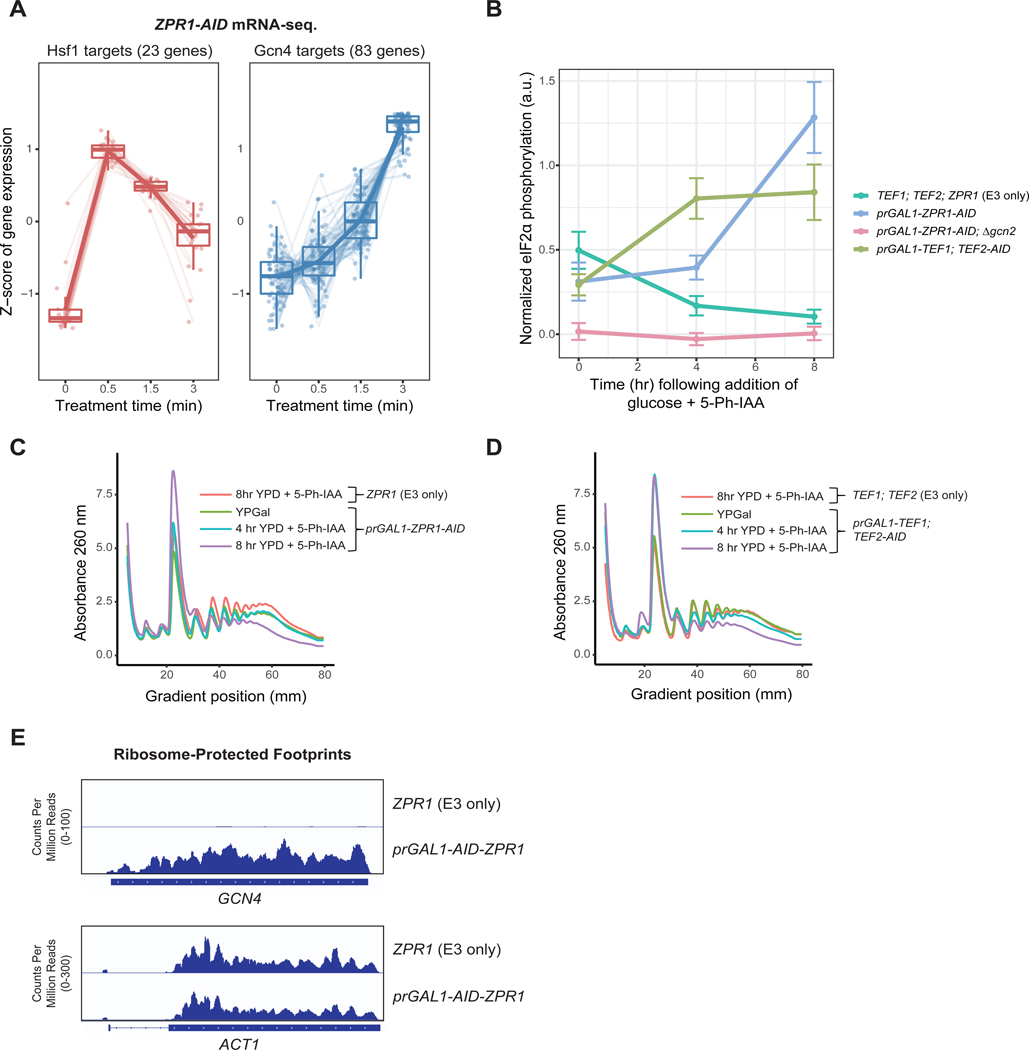
Figure 3. Decreased eEF1A abundance following prolonged Zpr1 depletion induces the Integrated Stress Response. See also Figure S2.
(A) ZPR1-AID cells were treated with 5 μM 5-Ph-IAA and subjected to mRNA sequencing in triplicate. Each point denotes a gene in the indicated target category, where the gene abundance Z-score is obtained by gene-wise mean centering and scaling to the standard deviation across all timepoints using degPatterns. See STAR methods for further details (B) Indicated strains were grown in media with 2% glucose and 5 μM 5-Ph-IAA for the indicated times and lysates were analyzed via SDS-PAGE and immunoblotting. Plots show normalized signals as mean ± standard deviation of three replicates. (C) The indicated strains were grown in YPGal media then shifted to YPD containing 5 μM 5-Ph-IAA for the indicated times. Shown are A260 traces of cell extracts following fractionation by sucrose gradient centrifugation. (D) The indicated strains were analyzed as in part C. (E) Genome browser views of GCN4 and ACT1 ORFs showing normalized, aligned ribosome protected footprints from ribosome profiling of indicated strains.

