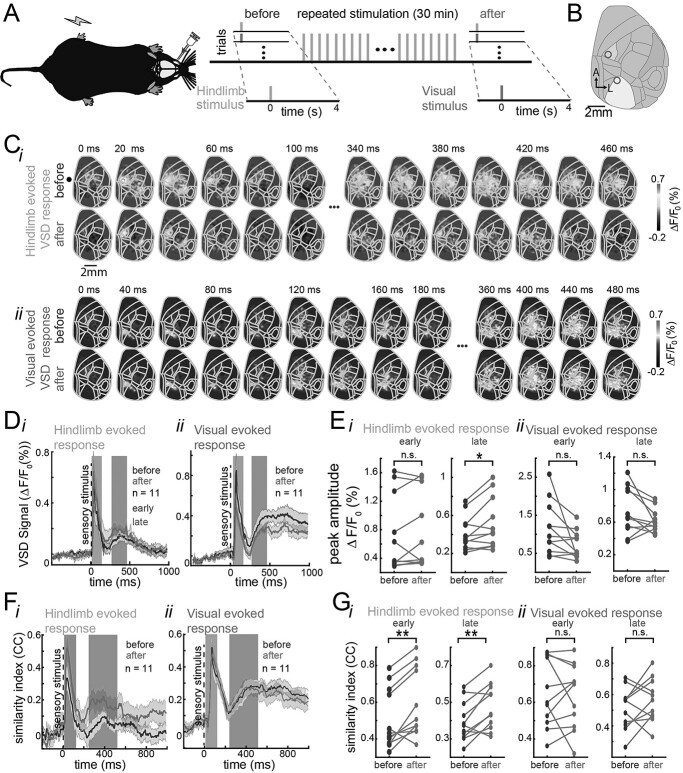
Fig. 3.
Spatiotemporal changes in the early and late evoked responses are stimulation dependent. A) Experimental protocol. The anesthetized mice injected with amphetamine received interleaved single-pulse electrical stimulation to the hindpaw and a LED flash as visual stimulation (20 trials each) followed by 20 min of repeated stimulation of the hindpaw at 20 Hz and finally received another interleaved single-pulse hindpaw and visual stimulation (20 trials each). B) Cortical map registered to the Allen Mouse Brain Atlas for our wide-field recordings. The blue region corresponds to the hindlimb area of the primary somatosensory area and the yellow region corresponds to the primary visual area. C) Example of trial-average evoked activity in response to hindlimb pulse stimulation (i) and visual stimulation (ii) before (top) and after (bottom) hindpaw repeated stimulation in the same mouse. D) Average evoked VSD response across animals before (dark line) and after (light line) hindpaw repeated stimulation in response to hindpaw stimulation (i) and to visual stimulation (ii). The shaded regions denote the SEM (animals n = 11). First and second background bars denote the early and late components of the evoked responses, respectively. E) Paired comparison of the peak amplitude of the early and late evoked response before and after repeated stimulation for hindpaw stimulation (i) and visual stimulation (ii) for all animals (n = 11). F) Average template similarity between early (left) and late (right) evoked responses to pulse hindpaw stimulus (i) and visual stimulus (ii) before (dark line) and after (light line) repeated hindpaw stimulation across animals. G) Paired comparison of the template similarity of early and late evoked responses to hindpaw (i) and visual stimulation (ii) before (dark dots) and after (light dots) during early (left) and late components (right) for all animals. * and ** represent significant increase in amplitude of the late evoked response after repeated hindpaw stimulation (t-test, P < 0.05 and P < 0.01, respectively).

