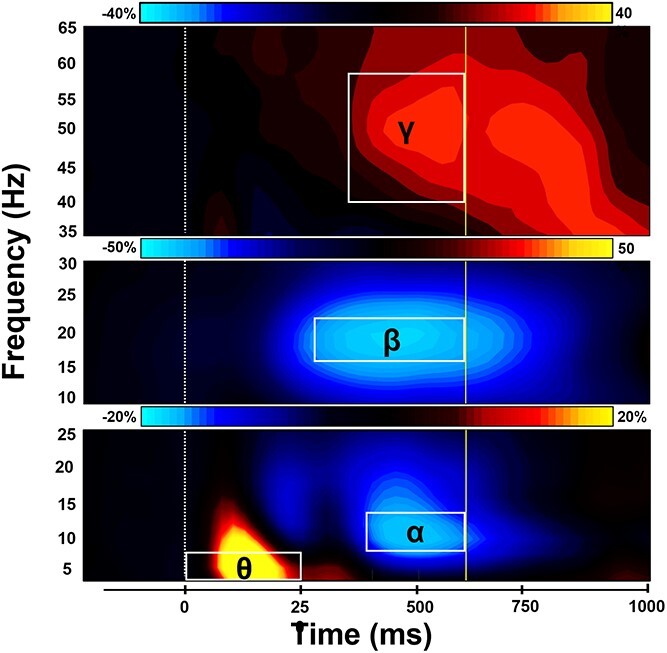
Fig. 2.

Sensor-level time–frequency spectrograms. Time–frequency spectrograms showing task-related oscillatory responses averaged across trials and participants. Time is on the x-axis while frequency is displayed on the y-axis. Color bars above each spectrogram indicate the percent change in power from baseline. (Bottom) Strong increases in theta (4–8 Hz; 0–250 ms) and decreases in alpha activity (8–14 Hz; 400–600 ms) were observed in sensors near occipito-parietal cortices (MEG2522). (Middle) A robust decrease in beta power (16–22 Hz; 275–600 ms) over the sensorimotor cortices (MEG0222) was also observed. (Top) Increases in gamma (40–58 Hz) neural responses emerged 350–600 ms following stimulus onset in sensors near occipito-parietal areas (MEG2342). Each oscillatory response significantly differed from baseline (P < 0.001, corrected) and has been outlined and labeled accordingly. The dotted line (at 0 ms) indicates the stimulus onset, and the solid line (at 600 ms) represents average task reaction time.
