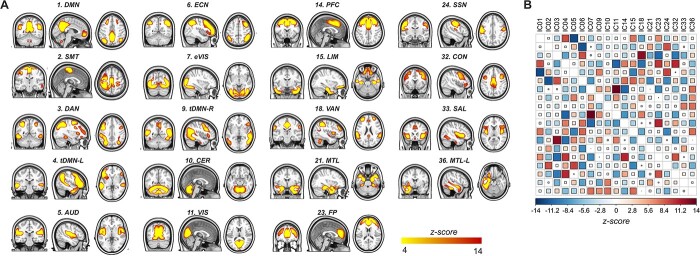
Fig. 1.
Functional resting-state networks across the entire sample. A) Nineteen biologically relevant spatial independent components identified in the whole sample, projected over single axial slices. B) Z-transformed connectivity matrix illustrating the spatiotemporal correlations among the identified networks. The intensity of the association between each network is encoded by both the square size and color. AUD, auditory; CER, cerebellar; CON, cingulo-opercular; DAN, dorsal attention; DMN, default mode network; ECN, executive control; eVIS, extrastriate visual; FP, frontal pole; LIM, limbic; MTL-L, left medial temporal; PFC, prefrontal; SAL, salience; SMT, somatomotor; SSN, somatosensory; tDMN-L, left temporal default mode network; tDMN-R, right temporal default mode network; TPB, temporo-basal; VAN, ventral attention; VIS, visual.

