
Fig. 4.
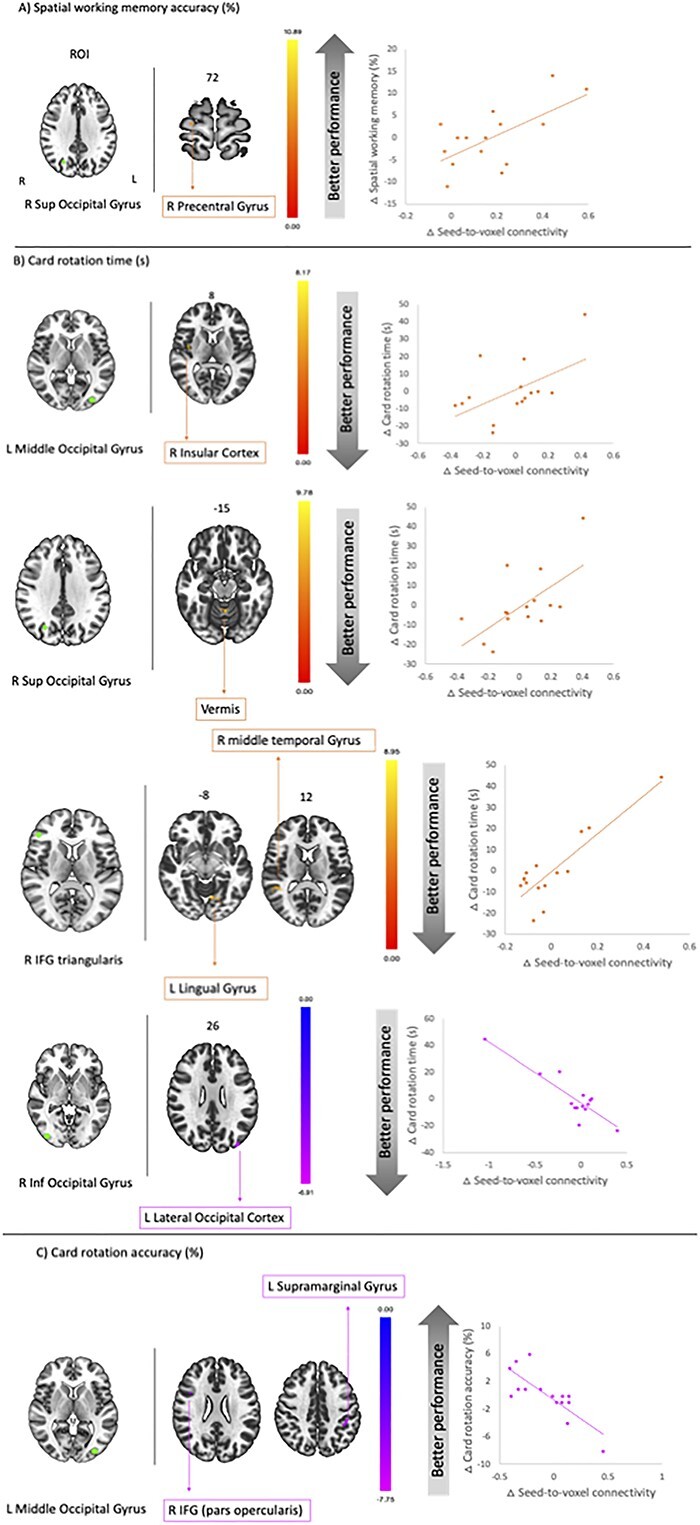
Correlation between seed-to-voxel connectivity and SWM performance. Left. ROIs (seed—Green). A) SWM accuracy; B) card rotation time; C) card rotation accuracy. Clusters in orange depict the positive correlation between pre- to post-flight changes in connectivity and pre- to post-flight changes in performance. Clusters in pink depict the negative correlation between pre- to post-flight changes in connectivity and pre- to post-flight changes in performance. Cluster-level FDR correction: P < 0.05. Minimum cluster size: k = 10 for all analyses. R, right; L, left. Results are overlaid onto a MNI standard template.