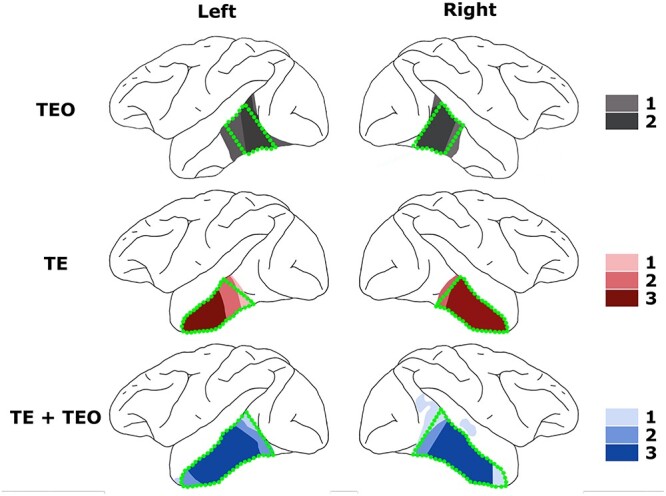
Fig. 2.

Lesion reconstructions. Lesion overlay maps for the respective treatment groups on a lateral view of the rhesus brain. Darker shading indicates greater within-group lesion overlap—The number of monkeys represented by each color is indicated in the legend. Green broken lines illustrate intended lesions. Detailed lesion reconstructions for individual monkeys have been published previously (Eldridge et al. 2018; Setogawa et al. 2021).
