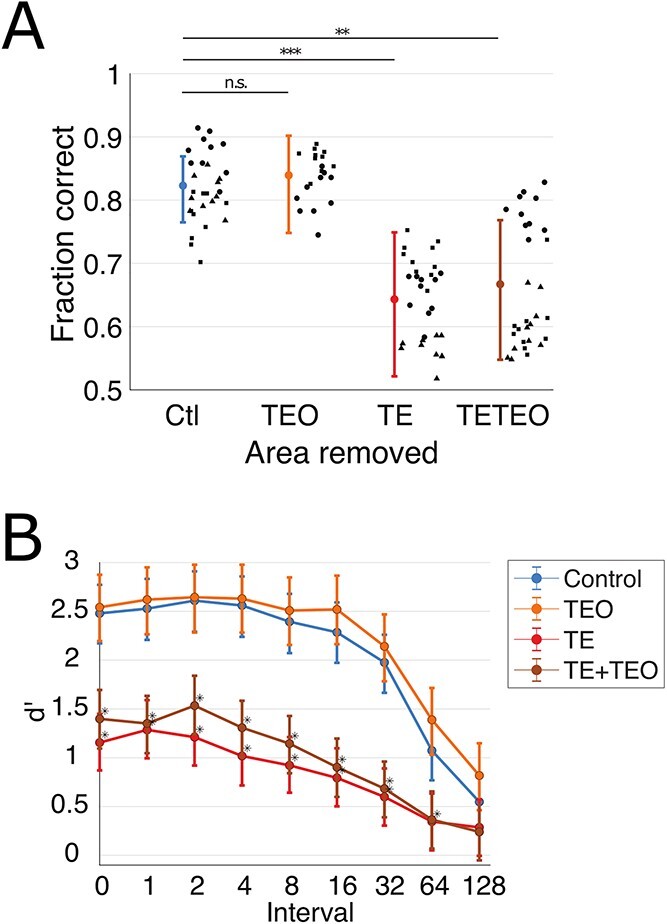
Fig. 4.

Monkeys with TE and TE + TEO removals have impaired recognition relative to controls and those with TEO removals. A) Overall fraction correct trials for the 10 sessions of stable performance on the hardest difficulty level of the task. Bars indicate mean and 95% confidence intervals from GLM. Points indicate overall percent correct for individual sessions, different shapes within each group correspond to individual subjects (matched with Supplemental Fig. 4-1). B) Group-mean d’ as a function of interval. Bars indicate median and 68% confidence intervals (analogous to mean and SEM) from the Bayesian multilevel model. Asterisks indicate strong evidence for d’ values differing from control values (strength of evidence > 95%, see Methods).
