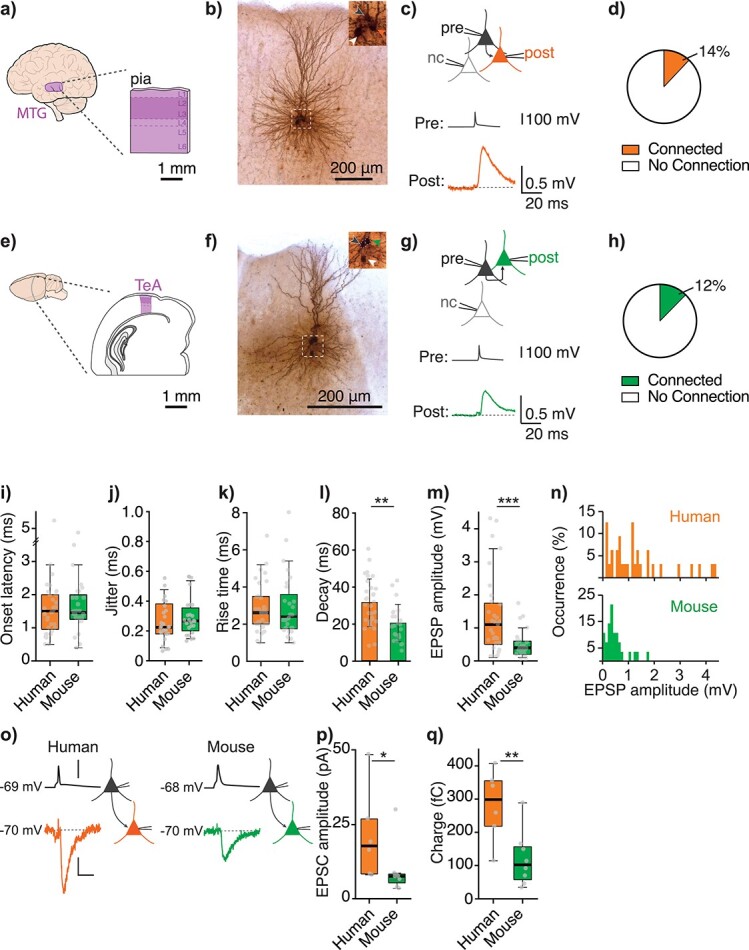
Fig. 1.

Local pyramidal-to-pyramidal connections in human MTG are larger in amplitude compared with mouse temporal association area. a) Slice configuration of resected human MTG. b) Example image of recovered cluster of connected human pyramidal neurons. Inset shows a close up of somas with arrowheads indicating the pre- (black) and postsynaptic (orange) somas, as well as a third soma of an unconnected neuron (white). c) Top schematic image depicts the recording configuration of the same cluster of neurons as in b) (pre: presynaptic, post: postsynaptic, and nc: no connection). Below example traces are the averaged traces from this cluster showing the evoked action potential in the presynaptic neuron (black trace) and the resulting EPSP in the connected postsynaptic neuron (orange). d) Pie graph showing connection rate in human for 157 tested pairs of neurons (14%, 25 of 185 tested pairs were connected). Only connections where we also stored the corresponding number of “no connection” tested pairs during the experimental session were counted for this analysis. e–h) Show the same as above but in mouse temporal association area (TeA). Postsynaptic neurons are represented in green (f–h) and mouse connection rate shown in h) was 12% (n = 28 of 234 tested pairs of neurons, P = 0.7, Fisher’s exact test). i) Average onset latency (P = 0.6, Mann–Whitney test). j) Average onset latency jitter (P = 0.3, Mann–Whitney test), dotted line indicates cut-off jitter for monosynaptic EPSPs (Lalanne et al. 2016). k) Median rise time (P = 0.7, Mann–Whitney test). l) Mean decay time constant (P < 0.01, unpaired t-test). m) n median amplitude (P < 0.001, Mann–Whitney test) of EPSPs in human (orange) and mouse (green). o) Schematic images and example traces of human and mouse connections in voltage clamp with presynaptic neurons and their traces depicted in black and postsynaptic neurons and their traces in orange (human) or green (mouse). Membrane potential values at the left of each trace correspond to the resting membrane potential for presynaptic traces and the holding potential for postsynaptic traces. Scalebars 100 mV, 5pA, and 10 ms. p) Median amplitude of excitatory postsynaptic currents (EPSC, P = 0.03, Mann–Whitney test). q) Median response charge (P = 0.008, Mann–Whitney test). Boxplots in Fig. 1 (and Figs. 2–4 and Supplemental Figures) show median as central mark, the edges of the box the 25th and 75th percentiles, the whiskers extend to the most extreme data points, and the outliers are plotted individually.
