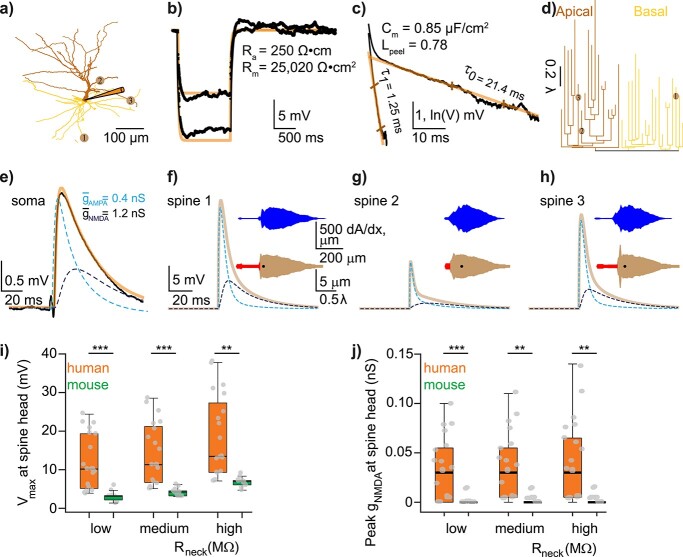
Fig. 4.
Properties of human L2/3–L2/3 synapses extracted via matching detailed neuron model to experimental pair-recordings. a) Modeled human L2/L3 neuron with dendritic locations of 3 synaptic contacts (numbered circles) originating from a single presynaptic L2/L3 neuron. Apical and basal trees are marked in dark and light orange respectively, schematic electrode at soma is also shown. b) Somatic voltage response (black traces) for the neuron shown in a) to 2 steady hyperpolarizing current inputs (here, −62 and −108 pA) and the corresponding model fit (brown traces) with respective model values for Ra and Rm. c) “Peeling” of somatic voltage transient in response to a brief (2 ms) hyperpolarizing step current (not shown) in the neuron shown in a). τ0, extracted from this peeling, together with Rm as in b), are used to calculate Cm, whereas Lpeel value is computed from τ1 and τ0 (see Methods). d) Electrotonic dendrograms of the neuron shown in a, with locations of the three synaptic contacts. e) Experimental somatic EPSP (black trace) in response to a presynaptic spike with model fit superimposed (light brown). Synapses were activated on modeled dendritic spines (see Supplemental Fig. S9 and Methods). AMPA- and NMDA- components of the modeled EPSP are also shown (dashed lines) with their respective maximal conductances value (at each synaptic contact). The NMDA-component is calculated by subtracting the AMPA component of the EPSP from the AMPA- plus NMDA-based EPSP. f–g) Computed EPSPs and respective AMPA- and NMDA-components at the spine head membrane located at the three synaptic sites shown in a). The upper (blue) and lower (red/brown) insets show, respectively, the spatial distribution of the neuron’s membrane area a) as a function of the physical distance, x, from the spine and the “equivalent cable” as seen from the spine perspective (spine is located at left end of these insets, soma location is marked by the black dot, see Methods). Observing the “equivalent cable” insets, the electrotonic decoupling of spine #1 and #3 from the impedance load due to the respective red cable (at the left of inset) results in relatively large EPSPs at these spines, whereas the large impedance load that is adjacent to spine #2 results in a relatively small EPSP at this spine. i) Computed EPSP peak at the spine head membrane for human (orange) and mouse (green) connections for different spine-neck resistances (Rneck). Low: Rneck human: 68.8 MΩ, Rneck mouse: 37.2 MΩ (these values were computed with spine dimensions as in Supplemental Table S2 and Ra = 250 Ω cm), medium: 200 MΩ for both human and mouse and high: 500 MΩ, for human and mouse respectively. Note that EPSP peak at the spine head membrane remains significantly larger in human also for a Rneck of 200 MΩ and 500 MΩ. j) as in i), now showing the NMDA peak conductance for each individual spine head for different Rneck cases. Low: Rneck human: 68.8 MΩ, Rneck mouse: 37.2 MΩ. Medium: 200 MΩ and high: 500 MΩ, respectively.

