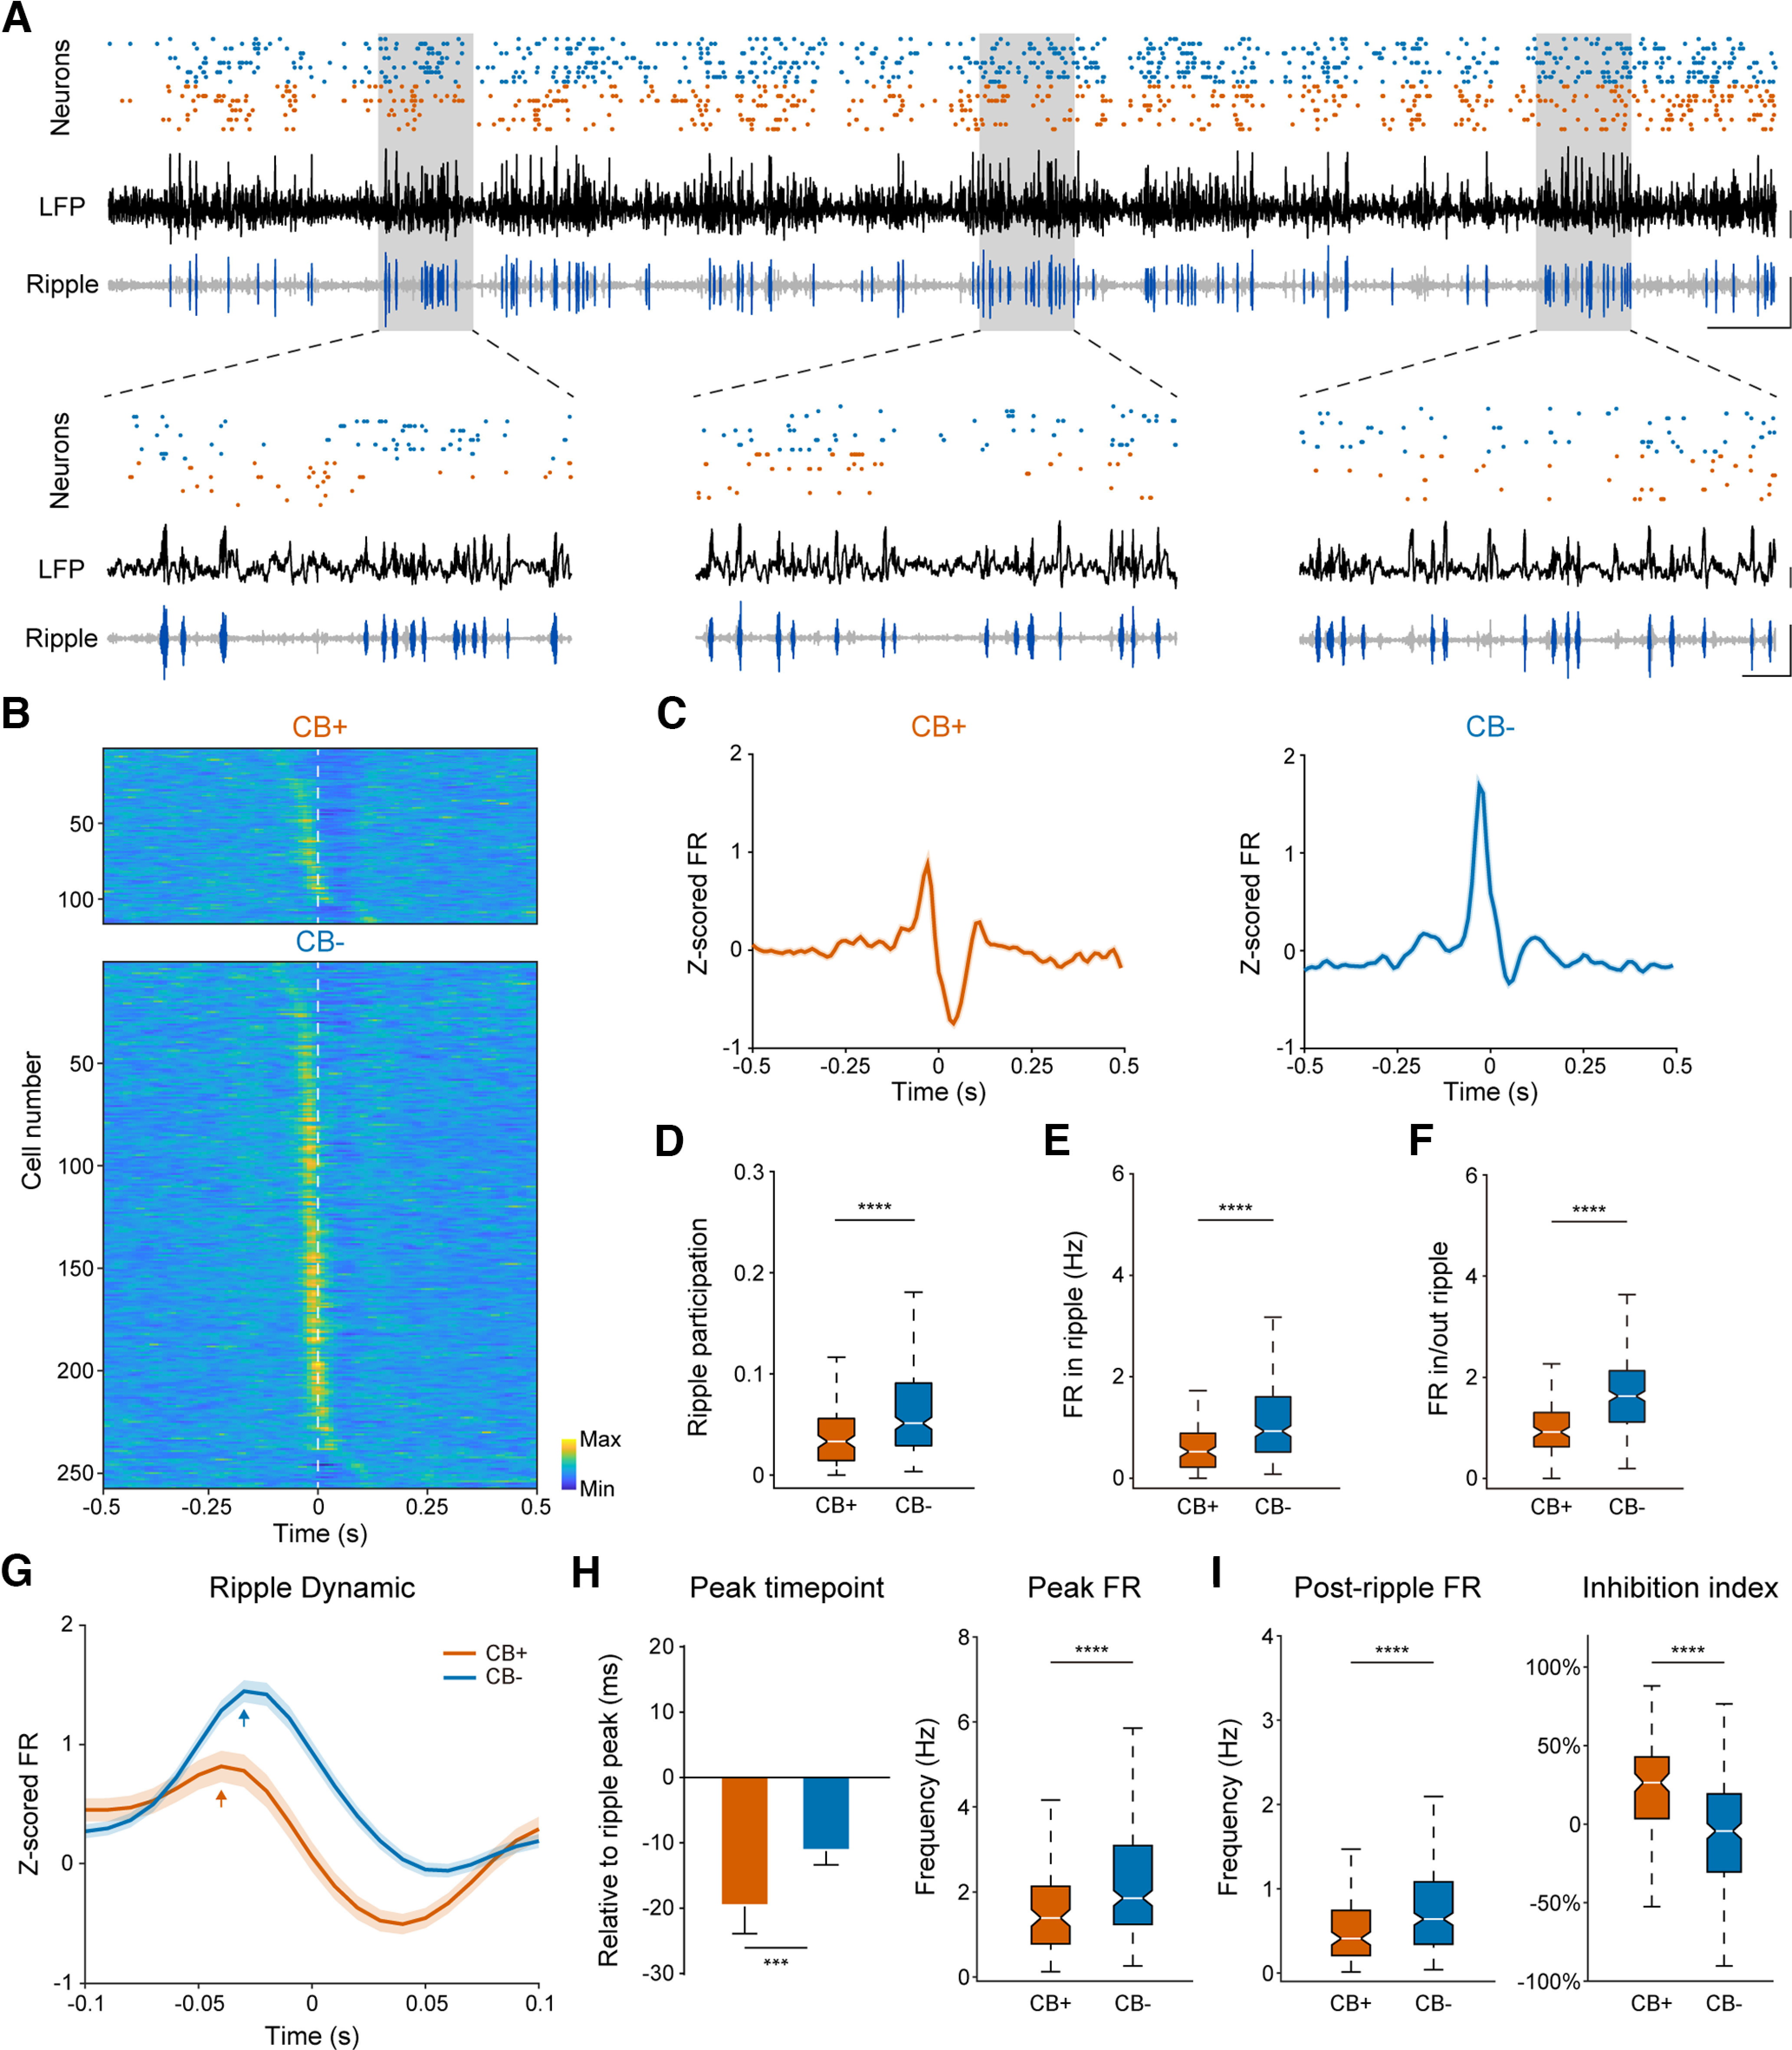
Figure 5.

CB− PNs are more actively engaged in hippocampal ripple oscillations during SWS. A, Top, Neuronal firing sequence of ten CB+ (blue dots) and ten CB− (orange dots) PNs along with hippocampal LFP (black trace) and bandpass filtered ripple oscillation (gray trace with ripple events highlighted in dark blue) during SWS. Scale bar: 0.2 mV, 0.5 s. B, Normalized neuronal firing of both PN subtypes during ripple oscillations (n = 3888 ripple events), sorted by peak firing time (n = 116 CB+ PNs, and 257 CB− PNs). Time zero represents ripple peak (white broken line). Note that CB− PNs exhibited higher firing rate before ripple peak, while CB+ PNs showed lower firing rate after LFP ripple peak. C, Normalized firing rate of each PN subtype population during hippocampal ripple oscillations. Time zero denotes ripple peak. Note that population activity of CB+ PNs are briefly suppressed after ripple peak. Bin size: 10 ms. D, Ripple participation of both PN subtypes. CB− PNs are more actively engaged in ripple oscillations (****p = 4.2e-9, Mann–Whitney test). E, Average firing rate of both neuron subtypes during ripple oscillations (****p = 1.4e-9, Mann–Whitney test). F, Firing rate ratio inside and outside ripple oscillations of both CB+ and CB− PNs (****p = 3.8e-15, Mann–Whitney test). G, Normalized firing rate dynamics of both PN subtypes during ripples. Shown here is 0.1-s data around ripple peak. Bin size: 10 ms. H, Time and peak firing rate of both PN subtypes relative to LFP ripple peak. CB+ PNs participated earlier in ripples than CB− PNs (***p = 1.3e-3, ****p = 1.2e-5, Mann–Whitney test). I, Left, Postripple firing rate of both PN subtypes. The activity of CB+ PNs decreased after ripple, and also significantly lower than CB− PNs (****p = 5.9e-6, Mann–Whitney test). Right, Ripple inhibition index of both PN subtypes. CB+ PNs were more strongly inhibited after ripple peak than their CB− peers (****p = 1.5e-11, Mann–Whitney test).
