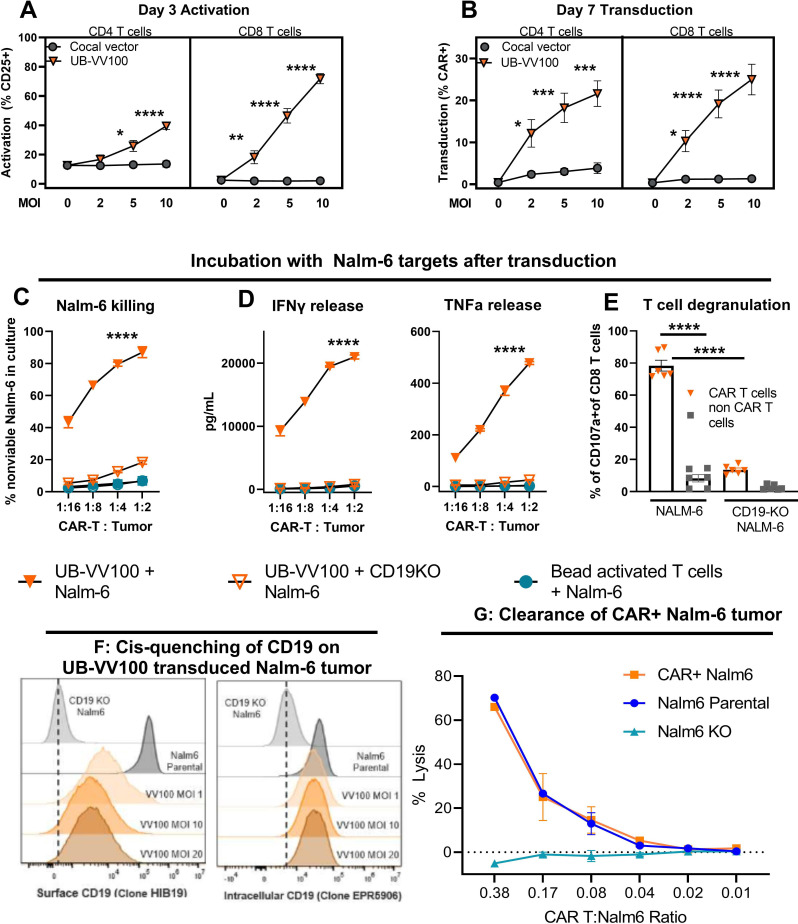
Figure 2.
UB-VV100 activates and transduces unstimulated T cells. UB-VV100 is added directly to cultured PBMCs in the presence of IL-2 and no additional stimulation. Activation, transduction, and rapamycin-mediated expansion are evaluated in the wells. (A) T-cell activation, measured by expression of CD25 (IL-2 receptor alpha), 3 days after vector addition. (B) T-cell transduction frequency, measured by surface FMC63 CAR expression, 7 days after vector addition at the indicated MOI. Data points represent mean±1 SEM. Data represent pooled results of n=5 for three unique donors analyzed in two independent experiments. The symbol * indicates significance using two-way ANOVA full interaction model with Tukey’s tests for multiple comparison on the indicate time point. (C) PBMCs transduced with UB-VV100 were incubated with CD19 KO Nalm-6 or parental Nalm-6 at varying E:T cell ratios as indicated. PBMCs activated with CD3/CD28 beads and incubated with parental Nalm-6 were used as an additional negative control. Cocultures were assessed for detection of dead Nalm-6 cells by flow cytometry and (D) release of IFN-γ and TNF-α into the culture supernatant. The symbol * denotes values indicating significance for ordinary two-way ANOVA, comparison of UB-VV100+Nalm-6 compared with the other groups at the indicated time point by Tukey’s postcomparison test. Partial results are related for simplicity. n=3 unique donors per group, combined the result of two independent experiments originally performed in technical duplicate. (E) CAR T cells were cultured with Nalm6 cells at an E:T of 1:2 for 4 hours, and degranulation was measured in P2A+CAR+ CD8+ T cells or P2A−negative non-CAR CD8+ T cells by flow cytometric detection of extracellular CD107a. The symbol * indicates significance for one-way ANOVA. Data represent two donors pooled from two independent experiments in technical duplicates. Nalm-6 cells were transduced with UB-VV100 at MOIs 1, 10, and 20. On day 10, CAR+Nalm-6 cells were stained with an anti-CD19 antibody (clone HIB19) to assess (F) surface CD19 expression levels and an anti-CD19 antibody that binds to an intracellular CD19 epitope (clone EPR5906) to determine the total CD19 protein level. (G) CAR T cells (VV100, MOI 5) from three healthy donors were cocultured with CAR+Nalm6 cells (VV100, MOI 10), non-transduced Nalm6 parental cells, or CD19 KO Nalm6 cells (Nalm6 KO) at multiple CAR T to Nalm6 ratios. After 24 hours of coculture, CAR+Nalm6 cells were identified based on P2A transgene expression, and the frequency of dead Nalm6 cells was determined by viability dye staining via flow cytometry. The percentage of lysis was calculated as the frequency of dead CAR+Nalm6 cells normalized to lysis of Nalm6 cells cocultured with mock transduced PBMCs. Data points represent mean±SEM. *P<0.05, **P<0.01, ***P<0.001, ****P<0.0001 for all data panels for the indicated analysis. ANOVA, analysis of variance; CAR, chimeric antigen receptor; E:T, effector-to-target; IFN-γ, interferon gamma; KO, knockout; MOI, multiplicity of infection; PBMC, peripheral blood mononuclear cell; TNF-α, tumor necrosis factor alpha.

