
Fig. 2.
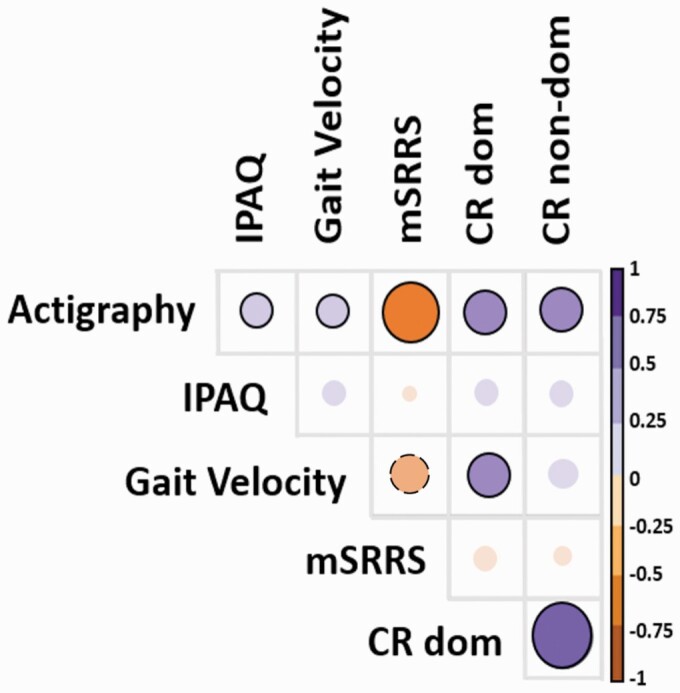
Partial correlations between measures.
Note: The larger the circle the stronger the association, the ones with a black circle around are significant and the ones with a dotted black line around are at trend level.
Official websites use .gov
A
.gov website belongs to an official
government organization in the United States.
Secure .gov websites use HTTPS
A lock (
) or https:// means you've safely
connected to the .gov website. Share sensitive
information only on official, secure websites.
Partial correlations between measures.
Note: The larger the circle the stronger the association, the ones with a black circle around are significant and the ones with a dotted black line around are at trend level.