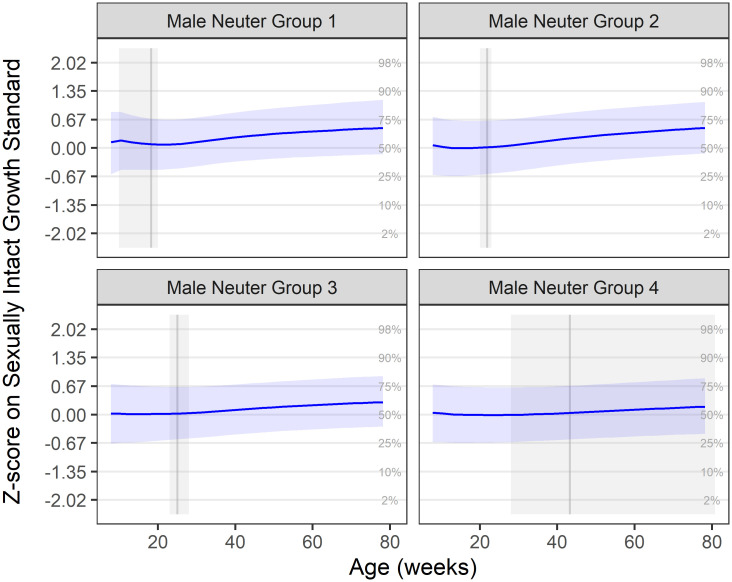
Fig 1. Median male growth trajectory by neuter group on z-score scale.
Neuter Groups 1–4 represent, respectively, neutering ages of up to 20 weeks (0.7k cats), 20–23 weeks (2.1k cats), 23–28 weeks (2.5k cats) and >28 weeks (3.0k cats). Groups calculated from the lower quartile, median and upper quartile of ages at all neutering procedures performed on DSH cats between April 1994 and November 2016. The solid blue line represents the mean trajectory, whilst the blue-shaded ribbon represents the interquartile range. The grey shaded area represents the neutering age range for the group, and the solid grey vertical line shows the median observed neutering age. Grid lines represent the standard growth centiles, such that a growth trajectory following the centile curves would be horizonal in these plots. In all groups, there was an upwards inclination in growth trajectory, which was most marked in neuter groups 1 and 2.

