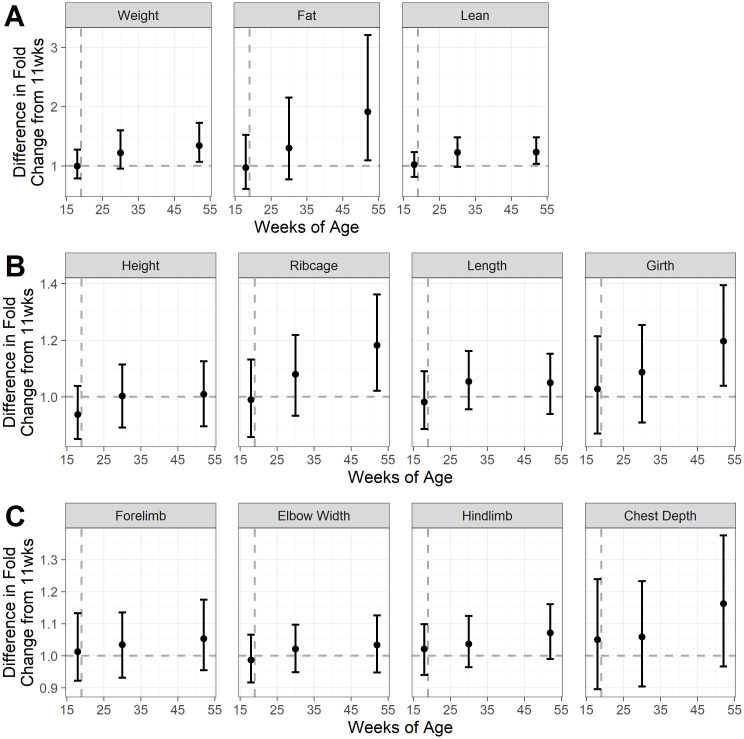
Fig 5. The estimated mean and 95% simultaneous credible intervals (difference between sexually-intact and neutered kittens (11 cats per group), in the fold-change for each measure, between 11 wk (when both groups were still sexually intact) and each subsequent timepoint.
Black dots represent the mean values, whilst error bars represent the 95% simultaneous credible intervals; the vertical grey dashed line indicates age of neutering. Differences are shown as the fold change of the neutered group divided by the fold change of the sexually-intact group, so that values >1 (shown by the horizontal dashed line) indicate that the neutered group had a greater difference in fold change. Panel A shows mass measurements, whilst and panels B and C show zoometric measurements. For details of the measurements see the legend for Fig 4.

