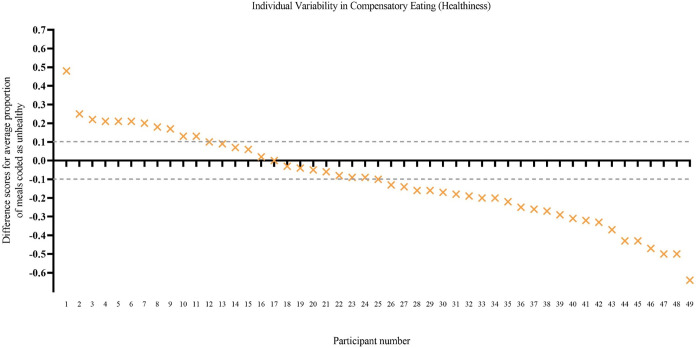
Fig 2. Individual variability in patterns of eating—Healthiness (Study 2).
The y axis shows a difference score for each participant: the proportion of post-exercise meals that that were unhealthy minus the proportion of random meals that were unhealthy. A positive score indicates that, on average, the participant consumed a greater proportion of unhealthy meals post exercise than at random meals (i.e., compensatory eating). Dotted lines indicate the boundaries (± 0.10) used to mark an eating pattern that was indifferent to exercise (similar proportion of unhealthy meals after exercise and at random meals). Participant scores are ordered in descending order from most compensatory eating to least compensatory eating. Difference scores could only be calculated for 49 of the 55 participants because six did not have any post-exercise meals.

