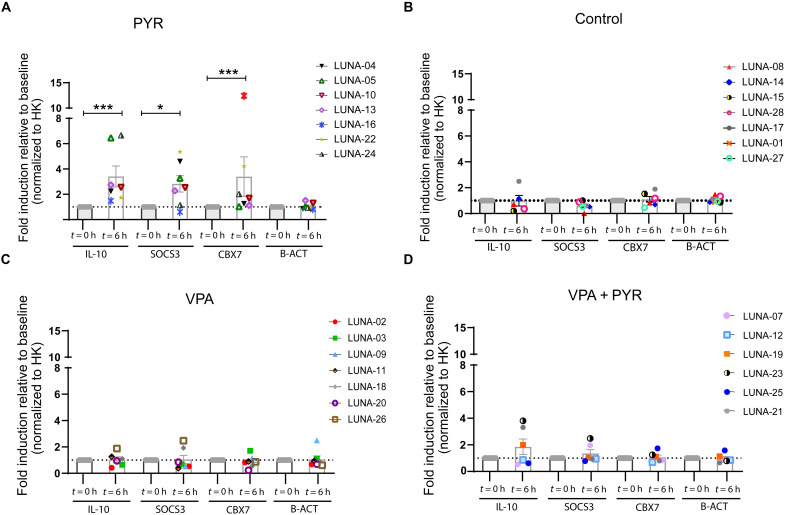
Fig. 5. Pharmacodynamics of the drug pyrimethamine in study participants.
(A to D) Gene expression profile of BAF complex molecular targets IL-10, SOCS3, and CBX7 in all participants from pyrimethamine (A), control (B), VPA (C), and the combination treatment arm with pyrimethamine and VPA (D) at 6 hours after first dosing (day 0, t = 6 hours). Graphs represent mean (SEM) fold induction relative to pretreatment level (day 0, t = 0 hours). Cyclophilin A was used as a housekeeping (HK) gene for normalization, and β-actin (B-ACT) was used as a control. P values were calculated using Mann-Whitney U test with * representing P < 0.05 and *** representing P < 0.01.

