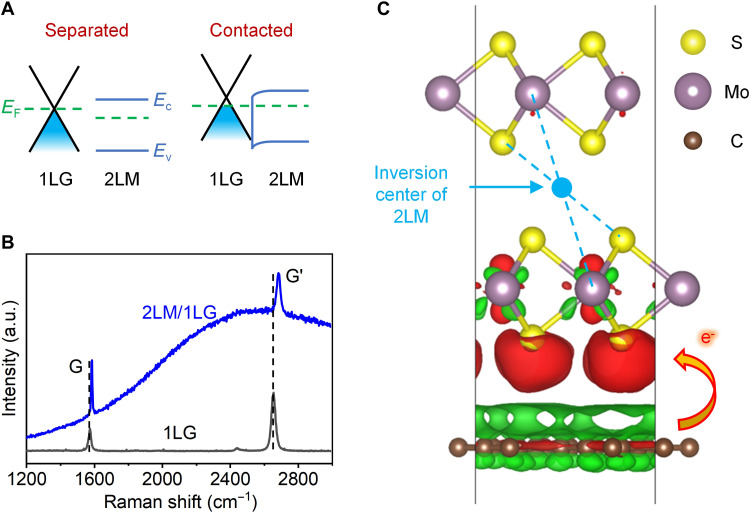
Fig. 2. Charge transfer between 1LG and 2LM.
(A) Schematic illustration of band alignment and charge transfer between 1LG and 2LM before and after their vdW contact. Here, EF refers to the Fermi level. Ec and Ev refer to the conduction band and valence band of 2LM, respectively. (B) Raman spectra of the separate 1LG and the 2LM/1LG vdWH. (C) Side view of isosurface plots of the induced charge density difference for the 2LM/1LG vdWH. The isosurface is taken to be 1 × 10⁻⁴ e/Å3. The red and green regions represent the accumulation and depletion of electrons, respectively.

