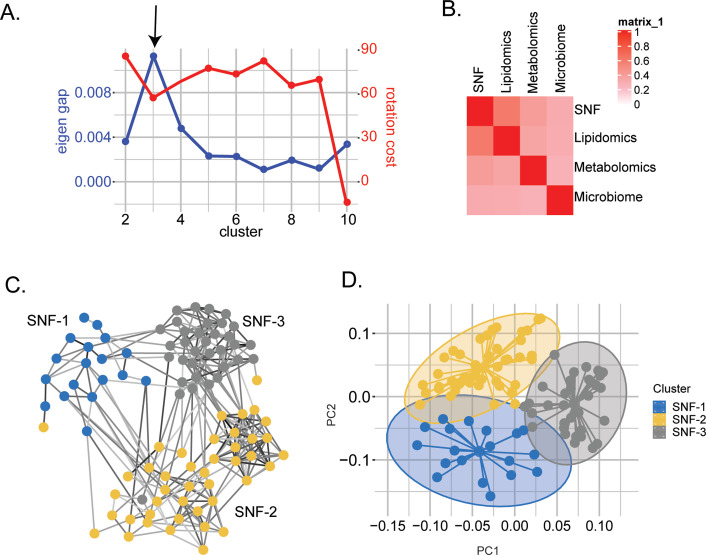
Figure 1. Similarity network fusion-based PWH stratification using lipidomics, metabolomics, and microbiome integration.
(A) Scatter plot showing the maximization of Eigen gap and the minimization of rotation cost for optimizing the number of clusters. (B) Concordance matrix between the combined network (SNF) and each omics network based on NMI calculation (0=no mutual information, 1=perfect correlation). (C) SNF-combined similarity network colored by clusters (SNF-1/HC-like=blue, SNF-2/severe at-risk=yellow, SNF-3/mild at-risk=grey) obtained after spectral clustering. Edges' color indicates the strength of the similarity (black = strong, grey = weak). (D) PCA plot of samples based on fused network. Samples are colored by condition.
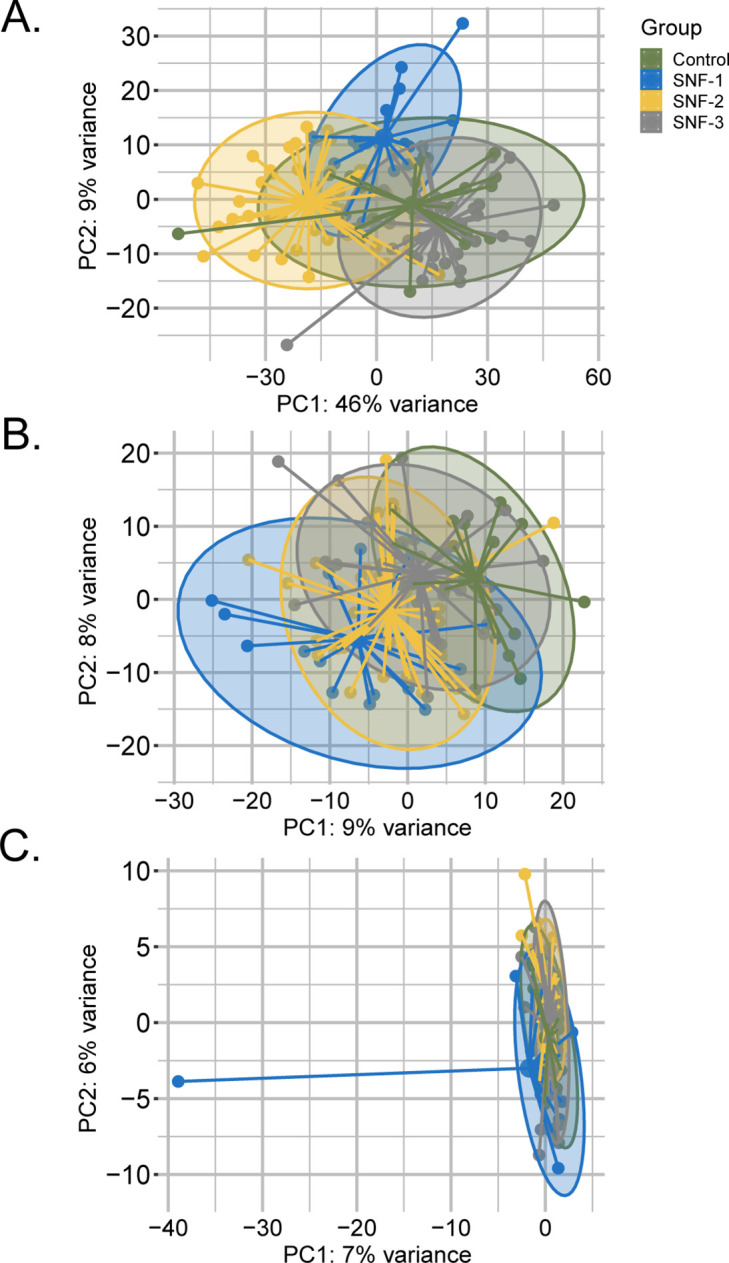
Figure 1—figure supplement 1. PCA plot of samples after prior standardization based on (a) Lipidomics (b) Metabolomics (c) Microbiome.


