
Figure 3.
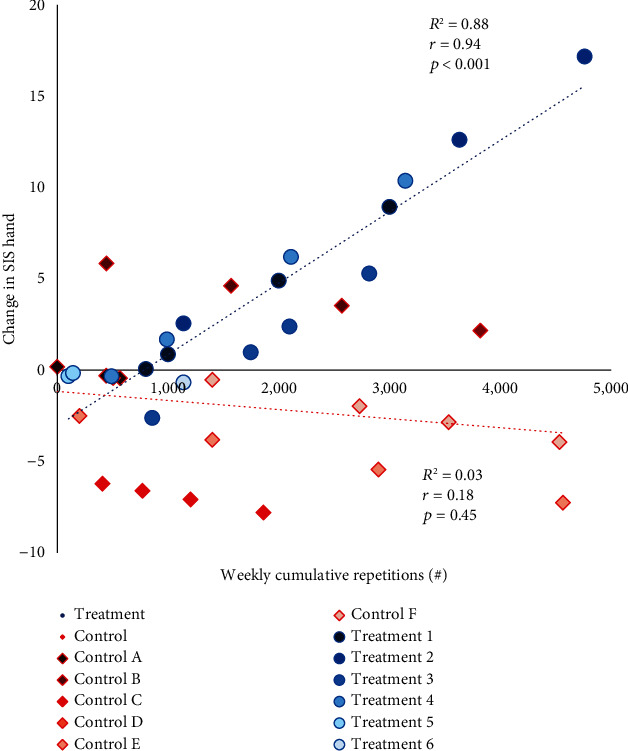
Relationship between cumulative repetitions for HEP vs. fitted model change in Stroke Impact Scale (SIS) Hand domain from baseline, at each of 4 weeks. Treatment group participants are represented by blue circles, and control group participants are represented by orange diamonds. Individual participants are numbered 1-6 for the treatment group (a–f) and for the control group and colored with a different gradient. There are multiple data points per participant because each participant was assessed multiple times.