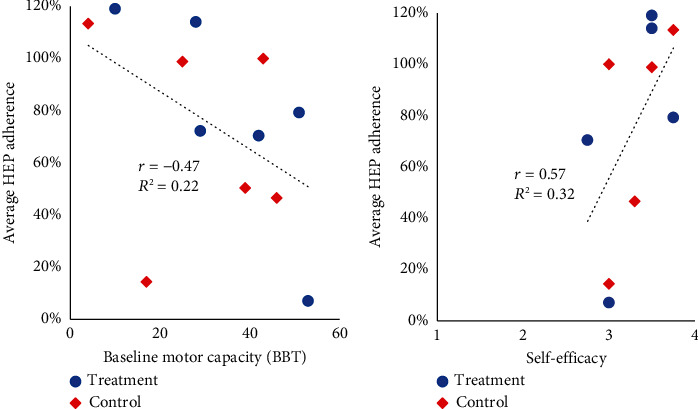
Figure 4.

Relationship between baseline motor capacity measured by the Box and Block Test (BBT) score and the average percent HEP adherence (a). Relationship between self-efficacy and average percent HEP adherence (b). The treatment group participants are represented by blue circles and control group participants are represented by orange diamonds.
