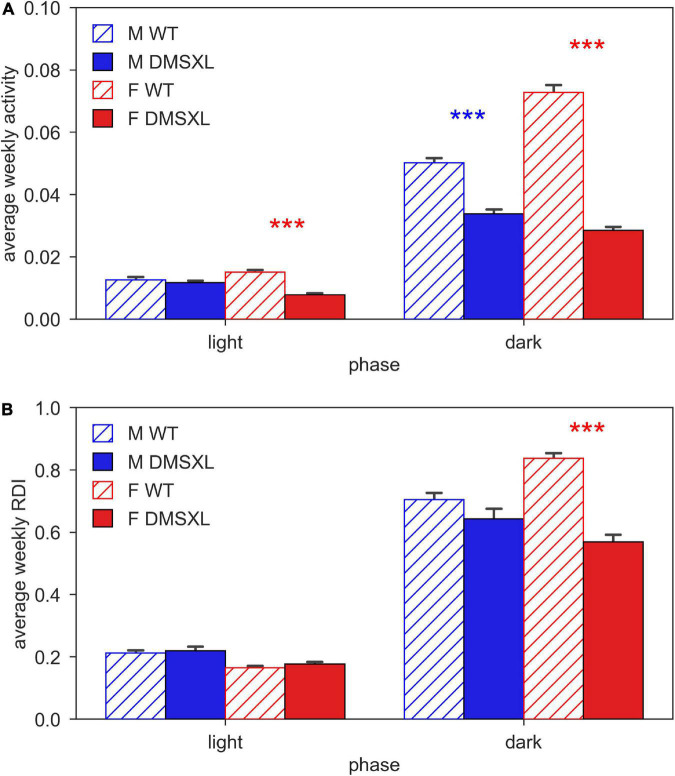
FIGURE 2.
Activity and regularity disruption index (RDI) during light and dark phase. Panel (A) shows the average weekly activity (±SEM) and panel (B) shows the average weekly RDI (±SEM), both over light and dark phases across the 5 weeks of experiment in male (M, blue) and female (F, red) cages of wild-type (WT) (diagonal lines) and DMSXL (filled bar) mice. N of cages per group: M WT = 10; M DMSXL = 10; F WT = 11; F DMSXL = 8. Bonferroni-corrected post-hoc tests to compare DMSXL and WT males (blue asterisks), and DMSXL and WT females (red asterisks), (***p < 0.001 nparLD test with genotype and week factors).

