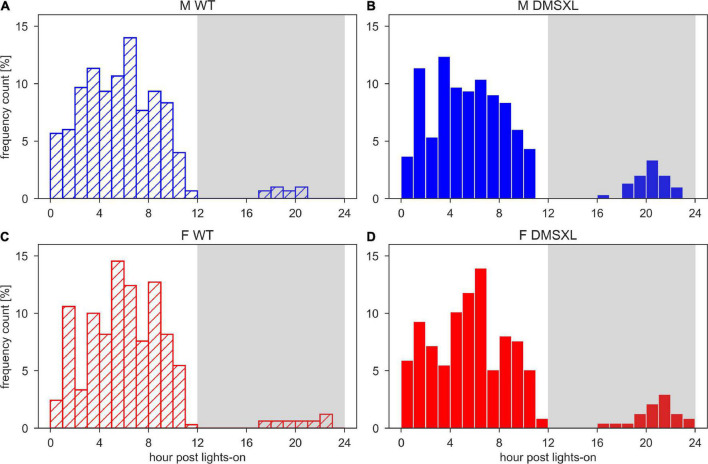
FIGURE 4.
Histograms of the time of the least active hour. Time of the day of the least active hour per each cage and each day of the 5 weeks of experiment in wild-type (WT) male (A), DMSXL male (B), WT female (C), and DMSXL female (D) mice. N of cages per group: M WT = 10; M DMSXL = 10; F WT = 11; F DMSXL = 8.

