FIGURE 8.
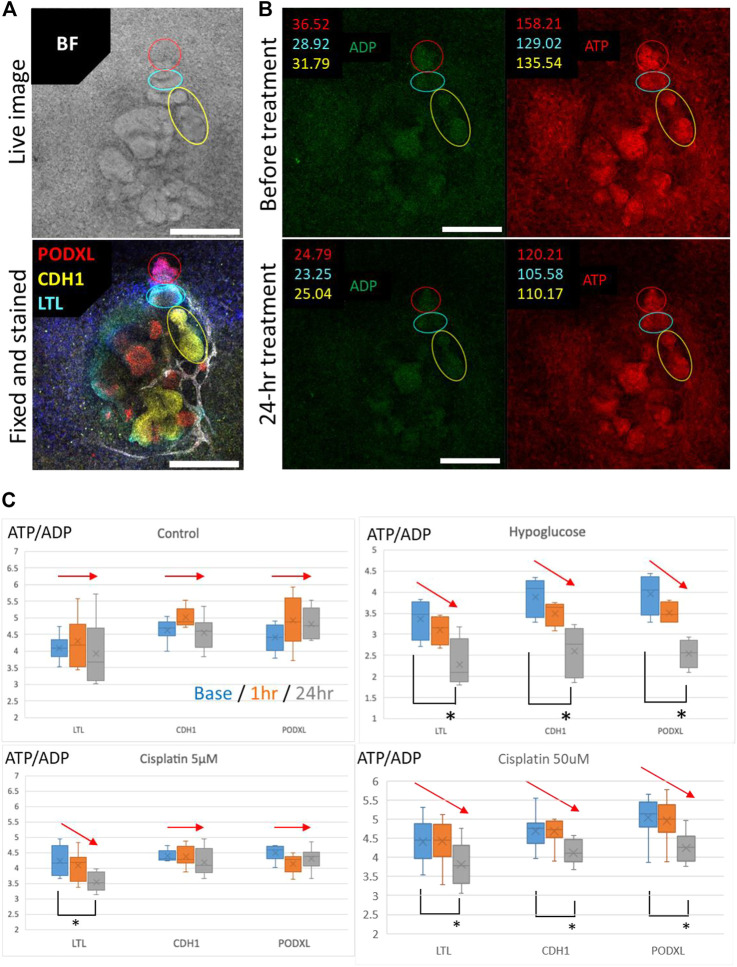
Evaluation of the segment-specific injury by Perceval HR organoids. (A) Representative BF image and IF image of PODXL (red), LTL (cyan), and CDH1 (yellow) in 2D organoids. Scale bars: 200 μm. (B) Representative images for quantification of ATP/ADP ratio matched in position with the BF and IF images for segment identification in 2D organoids exposed to 5 μM cisplatin. Scale bars: 200 μm. (C) Detection of ATP/ADP ratio of each segment in 2D reporter organoids treated with hypoglucose, 5 and 50 μM cisplatin for 24 h n = 4 to 15. *p < 0.05.

