
Figure 1.
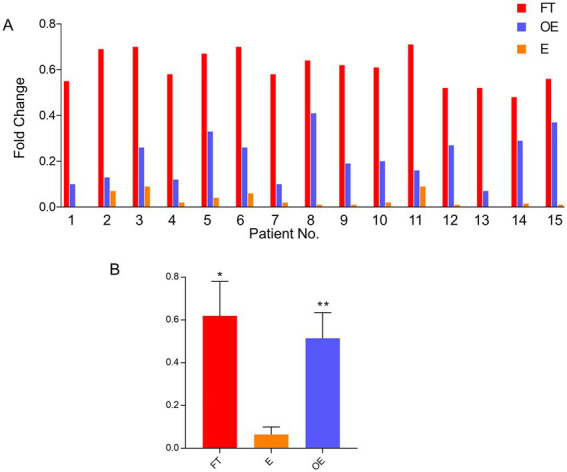
FOLR1 gene expression level in paired tubal, endometrial, and ovarian endometriosis samples. Comparisons of mRNA expression levels in the fallopian tube, the endometrium, and the foci of endometriosis by quantitative PCR in 15 individual paired cases (A) and the pooled data (B). FOLR1 levels in fallopian tube (FT) and ovarian endometriosis (OE) were similar, but both were higher than the observed FOLR1 level in the endometrium (E) [*p = 0.176 (FT vs. OE) and **p = 0.0018 (E vs. OE)]. FT: fallopian tube; E: endometrium; OE: ovarian endometriosis.