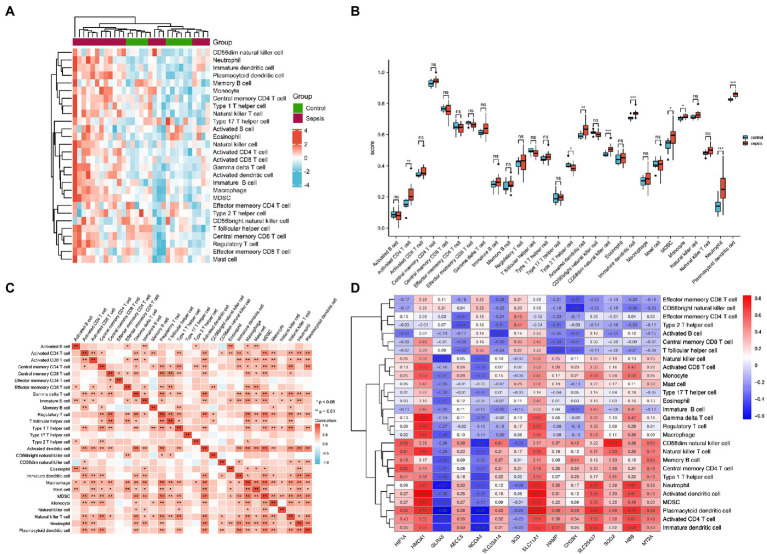
Figure 4.
Landscape of immune infiltration in the myocardium of patients with sepsis and controls. (A) Heatmap of the proportions of the 28 immune cell types. (B) Box plots of immune cell proportions. (C) Correlation analysis of immune cells. (D) Correlation between common differentially expressed IMRGs and immune cells.

