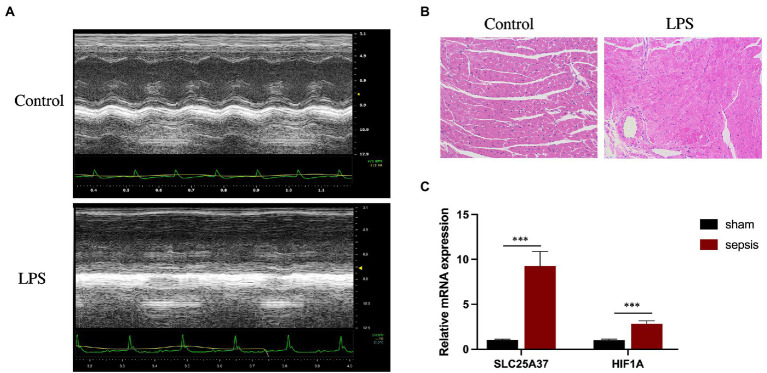
Figure 6.
Validation of SLC25A37 and HIF1A in a mouse model of LPS-induced sepsis using quantitative PCR analysis. (A) Transthoracic echocardiography between sepsis and control groups. (B) Hematoxylin and eosin staining. (C) Relative expression of SLC25A37 and HIF1A between sepsis and control groups in mice, along with the expression of β-actin as an internal standard for normalization. Asterisks indicate a significant statistical p-value calculated using Student’s t-test (*p < 0.05; **p < 0.01; ***p < 0.001).

