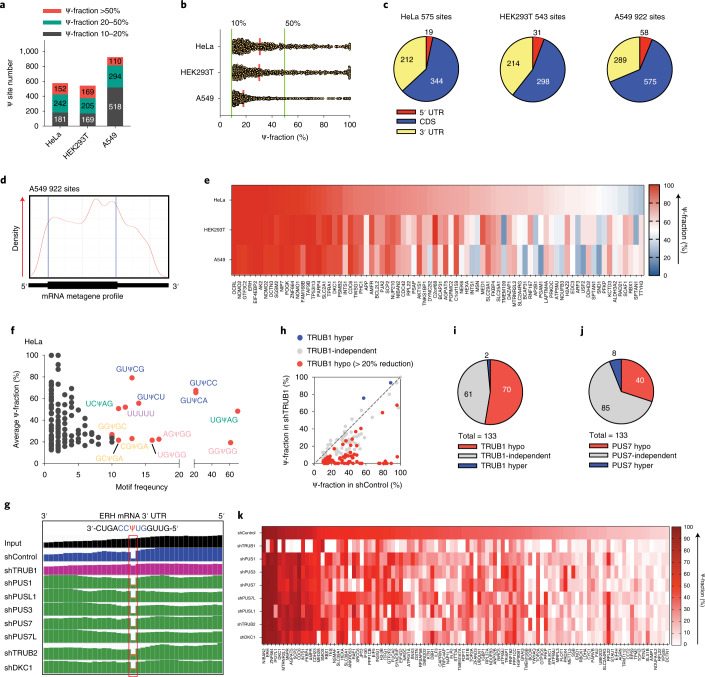
Fig. 3. BID-seq detects Ψ sites at base resolution in human mRNA and characterizes the ‘writer’ protein for individual Ψ sites.
a, BID-seq reveals 575, 543 and 922 Ψ sites (modification fraction above 10%) in HeLa, HEK293T and A549 cells, respectively. b, Modification level distribution of Ψ sites in mRNA from HeLa, HEK293T and A549 cells, with the definition of highly modified Ψ sites as those above 50% Ψ-fraction. c, Pie chart showing the distribution of mRNA Ψ sites in HeLa, HEK293T and A549 cells, with stoichiometry ≥10% in three mRNA segments. d, Metagene plot of 922 Ψ sites (modification fraction >10%) in A549 mRNA. e, Heatmap plot of Ψ-fraction for 78 overlapped Ψ sites with above 50% Ψ-fraction in at least one human cell line and above 10% Ψ-fraction in three cell lines, in a matrix of the corresponding gene name versus each cell line. f, Distribution of motifs for 575 Ψ sites in HeLa mRNA, with ‘x axis’ as the motif frequency and ‘y axis’ showing the average Ψ modification fraction of each motif. g, Example IGV plot to show raw reads coverage at the highly modified Ψ site in HeLa ERH mRNA. The deletion signatures reflect the modification level change in shTRUB1 versus shControl, but not depletion of other PUS enzymes. h, Among 133 Ψ sites (above 10% Ψ-fraction) in shControl HeLa mRNA, scatter plot of BID-seq data shows the reduced Ψ-fraction at 70 Ψ sites in TRUB1-depleted cells. i, Pie chart of TRUB1 hypo-regulated, hyper-regulated and TRUB1-independent Ψ sites. j, Pie chart of PUS7 hypo-regulated, hyper-regulated and PUS7-independent Ψ sites. k, Heatmap plot of Ψ-fraction for 104 Ψ sites that show reduced modification level under the depletion of a specific PUS enzyme or multiple PUS enzymes, in a matrix of the corresponding gene name versus the knockdown of each PUS enzyme.

