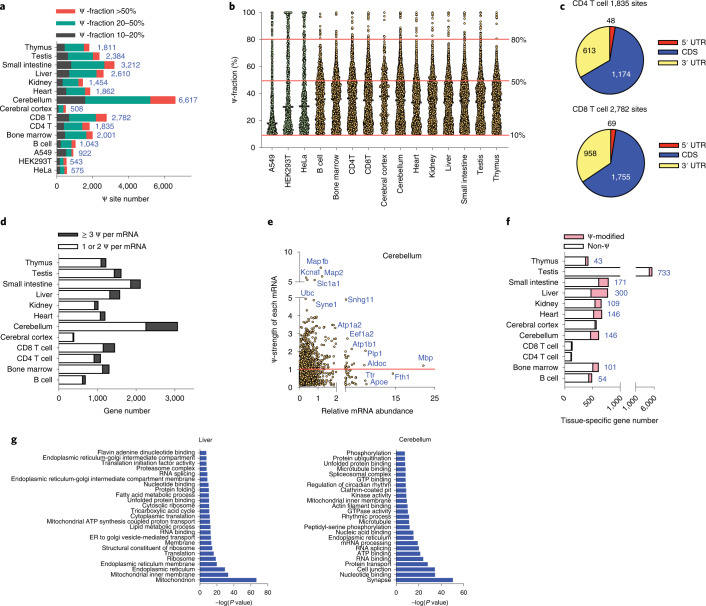
Fig. 4. Mouse tissue mRNAs are heavily modified with Ψ.
a, BID-seq reveals a large number of Ψ sites (modification fraction >10%) in 12 mouse tissues, with the Ψ site number in three human cell lines shown for comparison. b, Modification level distribution of mRNA Ψ sites in 12 mouse tissues, in which a number of Ψ sites are highly modified (modification fractions above 50%). The modification level distribution of Ψ sites in three human cell lines are shown as comparison. c, Pie chart showing the distribution of mRNA Ψ sites in CD4 T and CD8 T cells, with stoichiometry ≥10% in three mRNA segments. d, The number of Ψ-modified genes (with Ψ sites >10% fraction) that contain one or two Ψ versus above three Ψ sites per mRNA, in 12 mouse tissues. e, 2D plot of Ψ-modified genes (Ψ-fraction above 10% for each Ψ site) in mouse cerebellum, respectively, with ‘x axis’ as the mRNA abundance normalized to Rps8 (abundant nontarget gene, without any Ψ on mRNA) and ‘y axis’ showing the Ψ-strength of each gene, defined as the sum of Ψ fraction at all the Ψ sites within one mRNA. The cutoff of Ψ-strength 1.0 was marked by a red line. f, Among tissue-specific genes in each tissue type, the gene number distribution of non-Ψ-modified genes versus Ψ-modified genes. g, Top 25 enriched GO clusters from nontissue-specific Ψ-modified genes, in mouse liver and cerebellum, respectively. One-sided Fisher’s exact test. Adjusted P values using the linear step-up method.

