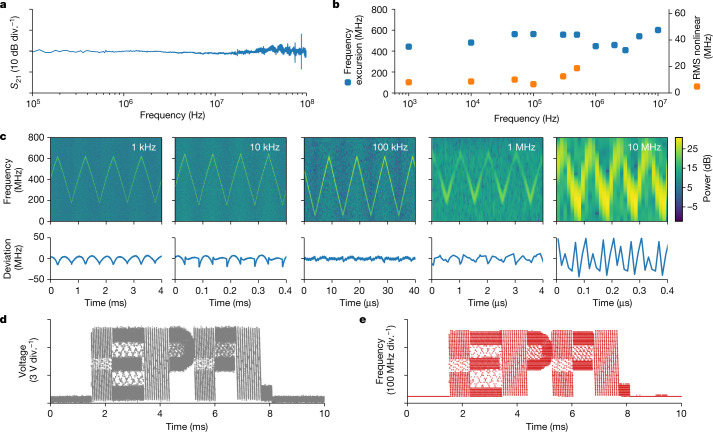
Fig. 3. Electro-optic frequency tuning of the self-injection-locked DFB laser.
a, Measured response of the electro-optic modulation for the heterogeneous Si3N4–LiNbO3 device utilizing tungsten electrodes. b, Frequency excursion (blue) and the absolute root mean square (RMS) deviation of the measured tuning profile from a perfect triangular ramp (orange). The deviation was calculated as the difference between the experimental data and the least-squares fitting. c, Top: time–frequency spectrograms of heterodyne beatnote for modulation frequencies from 1 kHz to 10 MHz. Bottom: the deviation of the experimental tuning data from the least-squares fit for the same modulation frequencies. d, Voltage profile applied to the electrodes from an arbitrary waveform generator, resembling the EPFL logo. e, Measured laser heterodyne beatnote showing laser frequency evolution in the form of the EPFL logo at a tuning rate of 450 Hz s−1.

