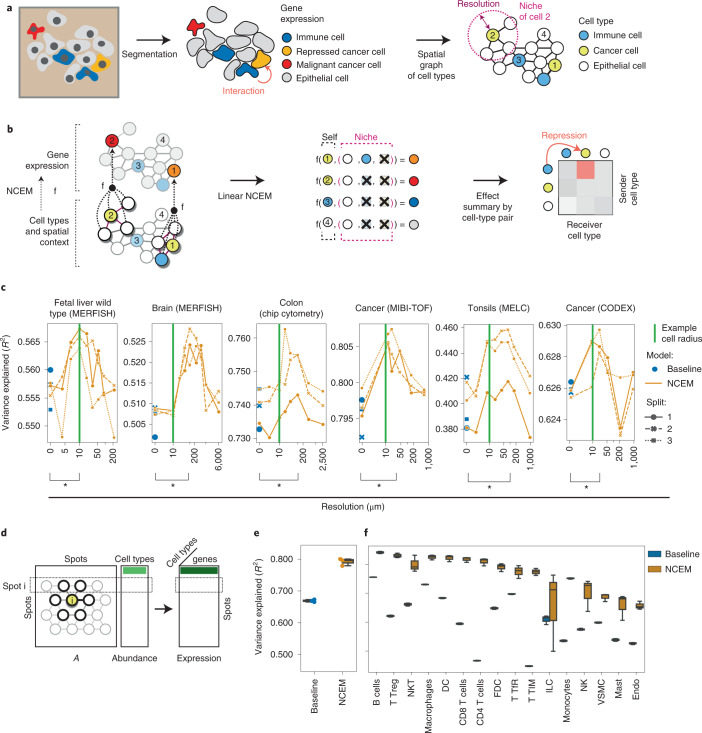
Fig. 1. Node-centric expression models capture statistical dependencies between cells in space.
a, Spatial graphs of cells are based on segmentation masks of cells in spatial molecular profiling data. Resolution is the radius of neighborhood used to define a niche. Numbers label cells and are used in Fig. 1b. b, NCEMs describe the gene expression observation of a cell as a function (f) of its spatial neighborhood (niche). c, Linear models capture neighborhood dependencies in spatially resolved single-cell data. Shown are the R2 values between predicted and observed expression vectors on held-out test cells by resolution for six datasets. Green line, 10 µm; baseline (blue points with cross-validation split indicated as shape), a nonspatial linear model; bracket (*), significant difference in paired t-test. d, Variation in deconvoluted expression vectors over spots for a given cell type can be attributed to spot composition with a linear NCEM. A, spot adjacency matrix. e,f, NCEM performance on deconvoluted data. Shown are the R2 values between predicted and observed gene expression vectors for held-out test spots of a linear NCEM in comparison to a baseline model that does not use the spot composition information. The performance is shown across the entire test set (e) and split by cell type (f) (n = 3 cross-validation splits). For each box in (e,f), the centerline defines the median, the height of the box is given by the interquartile range (IQR), the whiskers are given by 1.5 × IQR and outliers are given as points beyond the minimum or maximum whisker.

