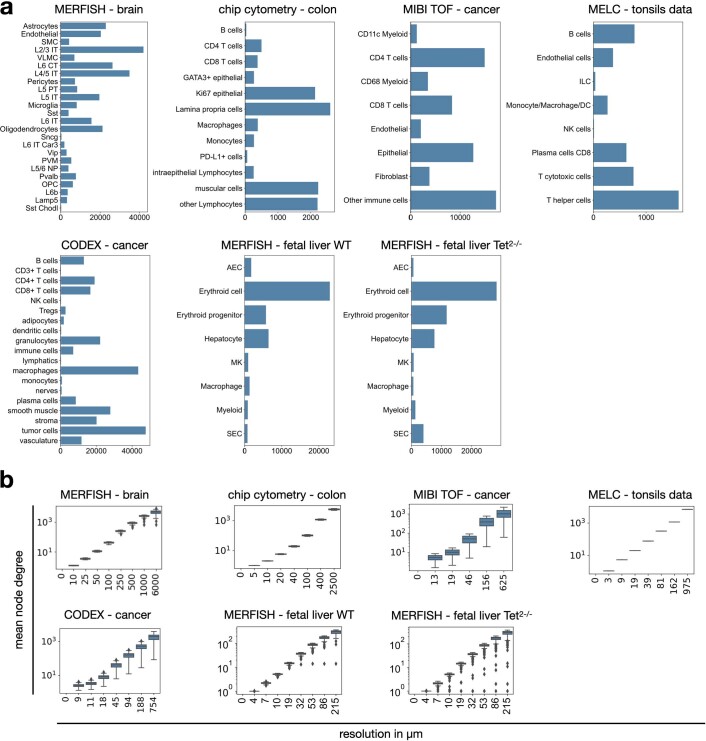
Extended Data Fig. 2. Cell-type centric summary statistics of the considered datasets.
(a) Cell-type frequencies by dataset. Shown is a barplot with the number of cells in each cell-type for MERFISH – brain data, chip cytometry – colon data, MIBI TOF – cancer data, MELC – tonsils data, CODEX – cancer data, MERFISH - fetal liver wild type and MERFISH - fetal liver Tet2−/−. (b) Mean node degree (number of neighbors) by resolution in µm and dataset for MERFISH – brain data (n = 284,098 cells), chip cytometry – colon data (n = 11.321 cells), MIBI TOF – cancer data (n = 63,747 cells), MELC – tonsils data (n = 9,512 cells), CODEX – cancer data (n = 272,266 cells), MERFISH - fetal liver wild type (n = 40,864 cells) and MERFISH - fetal liver Tet2−/− (n = 54,970 cells). For each box in (b), the centerline defines the median, the height of the box is given by the interquartile range (IQR), the whiskers are given by 1.5 * IQR and outliers are given as points beyond the minimum or maximum whisker.

